Maintaining a competitive edge is crucial to the long-term success of the business. Even though there are a plethora of factors that determine the success or failure of a business operation, business intelligence tools have been at the forefront of helping leaders make smarter and informed decisions while managing and analyzing business information.
Thanks to business intelligence tools, organizations of all sizes can establish innovative strategies by evaluating current market trends to score new opportunities and stay above their competitors. Among the most popular business intelligence applications in the market include Microsoft Power BI and SAS Business Intelligence. Outlined in this Microsoft Power BI vs SAS Business Intelligence comparison guide is essential information you need to pick a solution that optimizes your service for clients, enhances productivity, and track real-time information.
Microsoft Power BI Overview
Microsoft Power BI
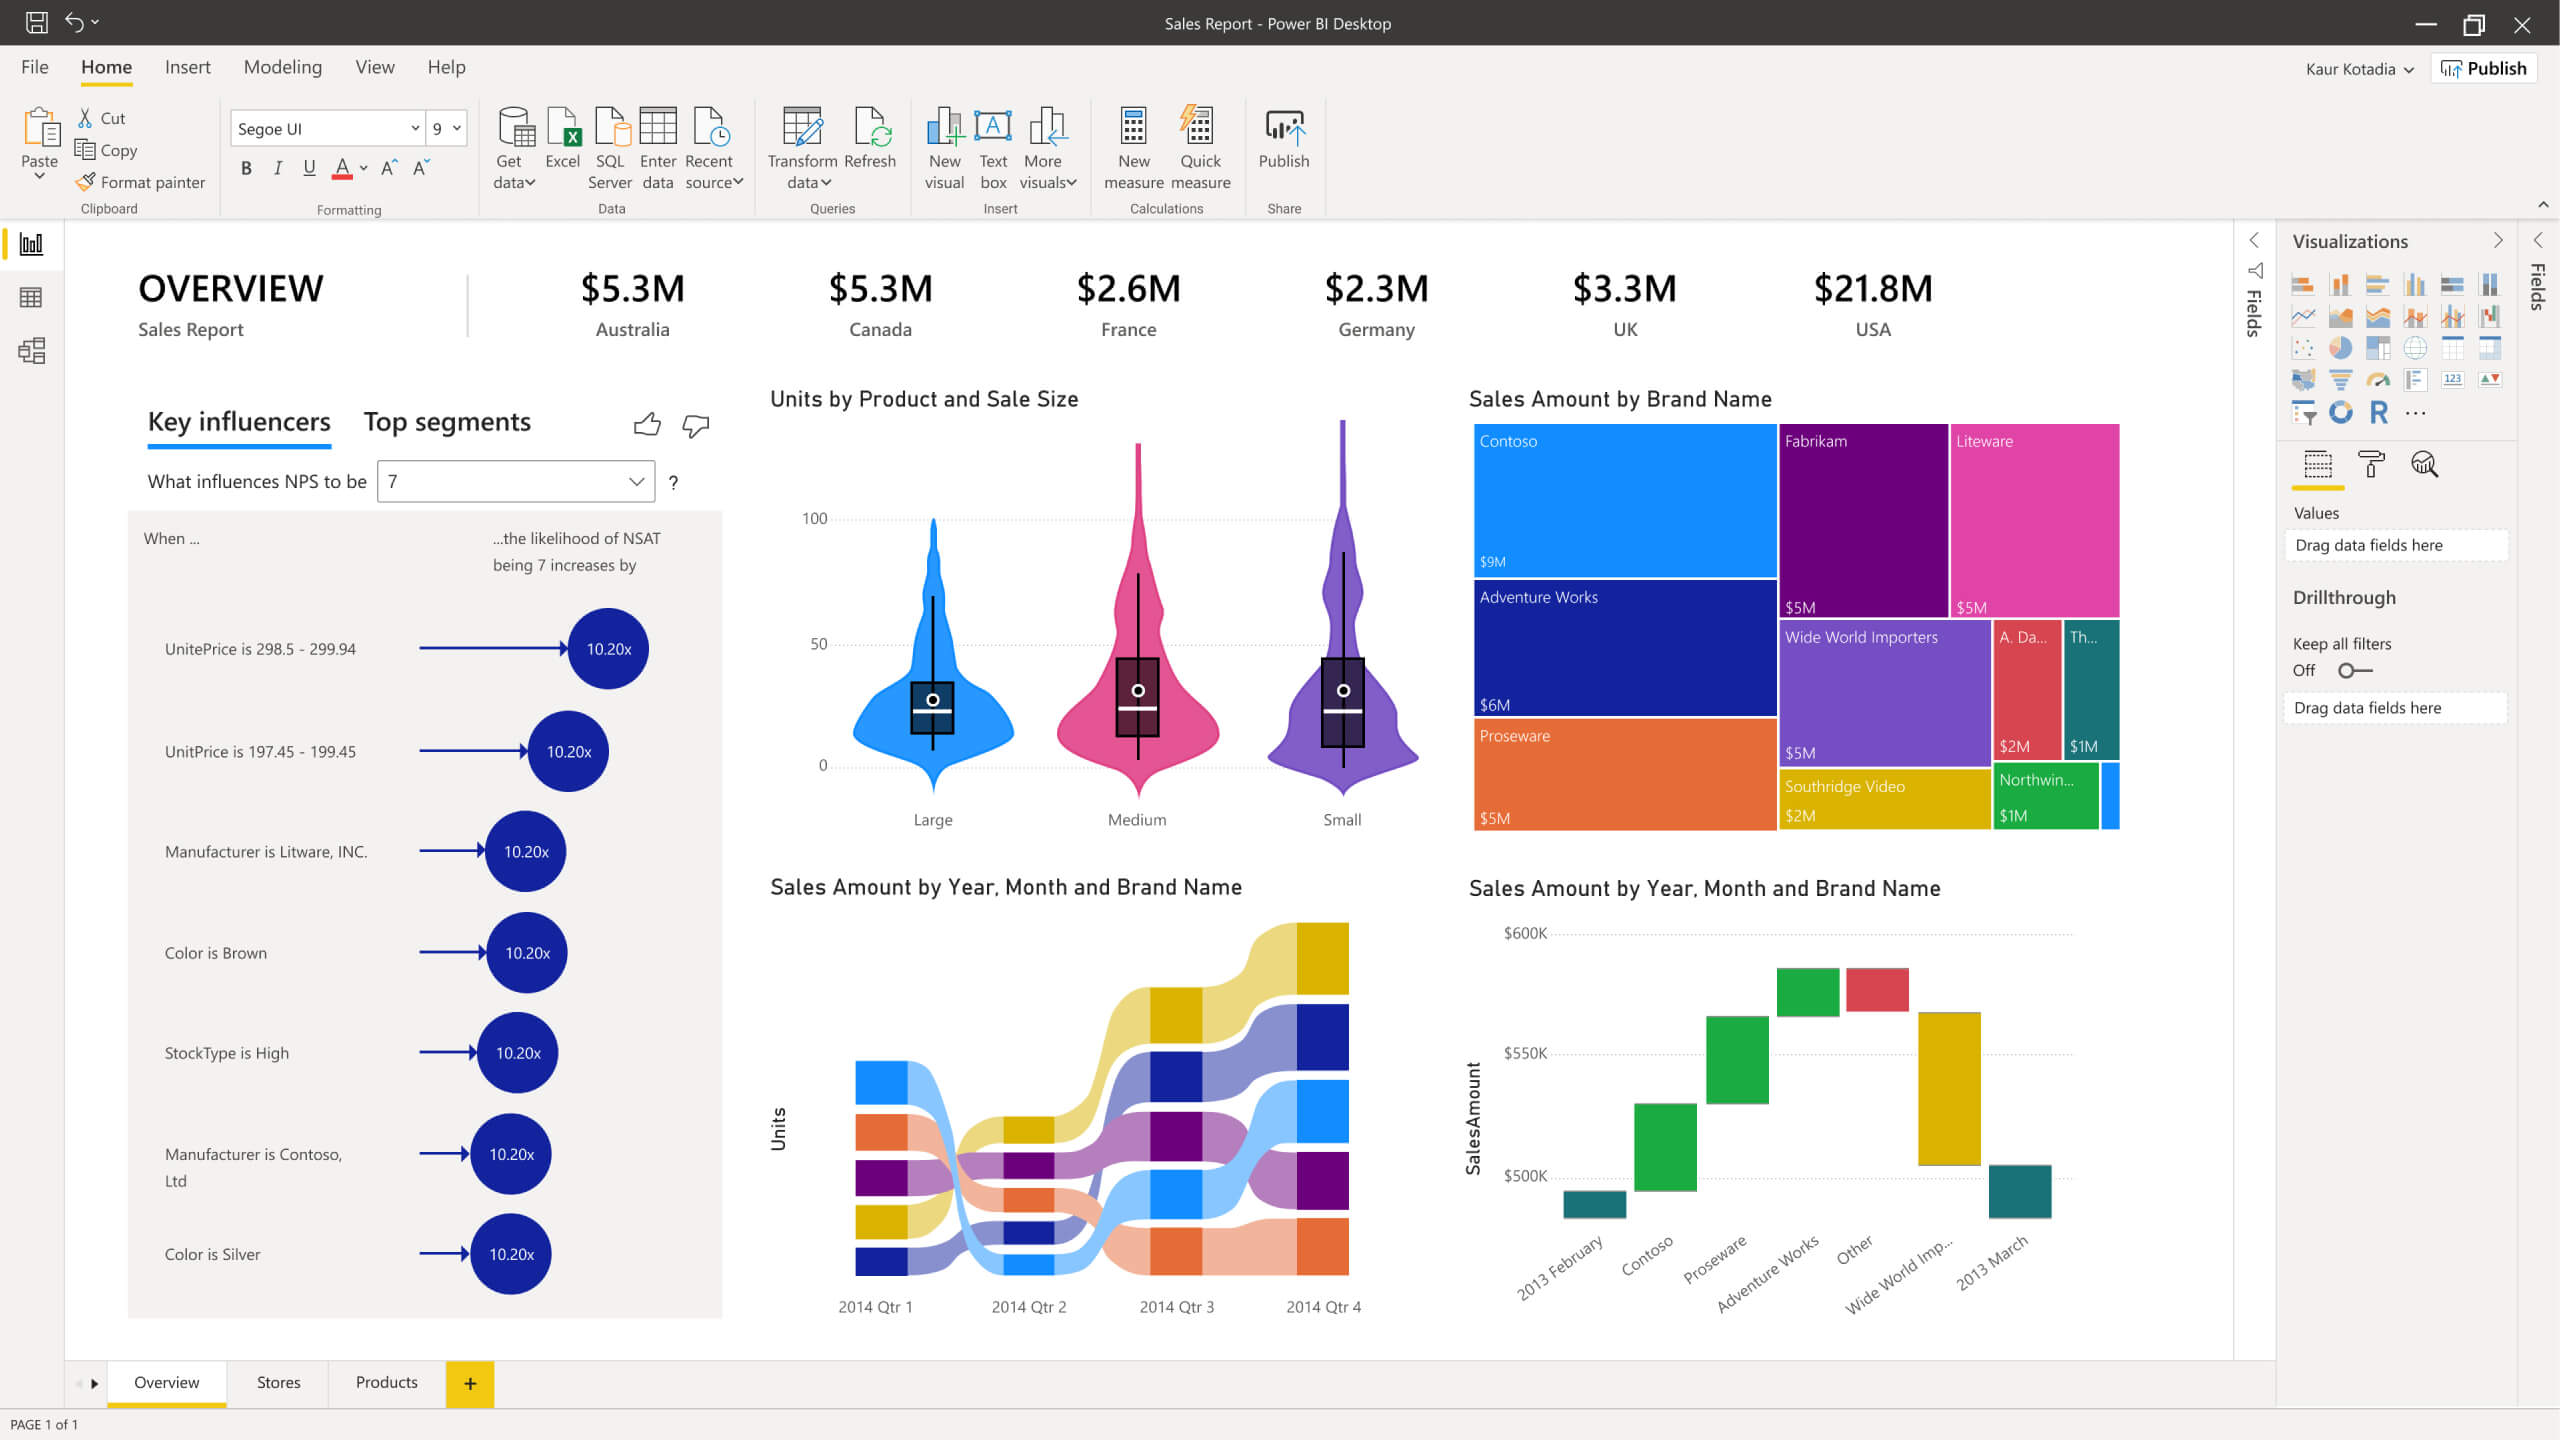
Microsoft Power BI is a collection of business intelligence, data visualization products, and reporting services designed to help individuals and business teams visualize information and share relevant insights across multiple departments. Launched in 2014, this dynamic business intelligence tool is geared with several products and services which include the Power BI mobile apps, gateway, report server, visuals marketplace, and desktop.
Unlike other solutions, Power BI is pliable enough to work with any data landscape, therefore, enabling businesses to import, distribute, and display information in the form of easy-to-understand and comprehensive visuals and reports. Plus, it can facilitate progressive analytical capabilities within days or even hours, depending on the workload to ensure that your analytical needs are satisfied.
As for its target users, Power BI accommodates all groups of users, including beginners, intermediate, and professionals, thanks to its capabilities that are built to satisfy all user levels. More often than not, businesses use the software to observe critical changes within their data patterns so that they can understand the overall performance of their investments in advertising, sales, and marketing.
On the other hand, data analysts use the software to derive complex performance evaluations for actions to be taken. At the same time, developers leverage it by embedding reports and data visuals to their front-end work and ad-hoc applications. What’s more, data models that are built from Power BI can be used to answer questions in real-time and assist with forecasting to ensure that departments meet key performance indicators.
Other than that, Power BI also employs row-level security to protect organizations and help them establish a data-driven culture with little to no risk of information exposed to unauthorized users. Through its security measures, businesses can keep track of user activity, initiate real-time risk evaluations, and set conditional access policies to prevent data breaches.
Interested users can try Power BI for free for 60 days before purchasing the subscription. It offers two pricing packages such as the Power BI Pro and the Power BI Premium, which are both expensive depending on the number of users. However, it is quite reasonable with so many advanced features included which is why it is part of our list of top BI and data analysis tools.
Pros:
- Regular Updates
- Excellent Data Connectivity
- Attractive Visualizations
- Microsoft Excel Integration
Cons:
- Complex User Interface
- Limited Data Management
- Rigid Formulas
- Lack of Native Visuals Configurations
Power BI Features
- Datasets
- Customizable Dashboards
- Reports
- Interactive Reports Authoring
- Trend Indicators
- Ad Hoc Evaluations
- Ad Hoc Reporting
- Feedback Buttons
- Navigation Pane
- Online Analytical Processing
- Live Data Dashboards
- Attractive Visualizations
- Datasets Filtrations
- Q&A Question Box
- Data Democratization
SAS Business Intelligence Overview
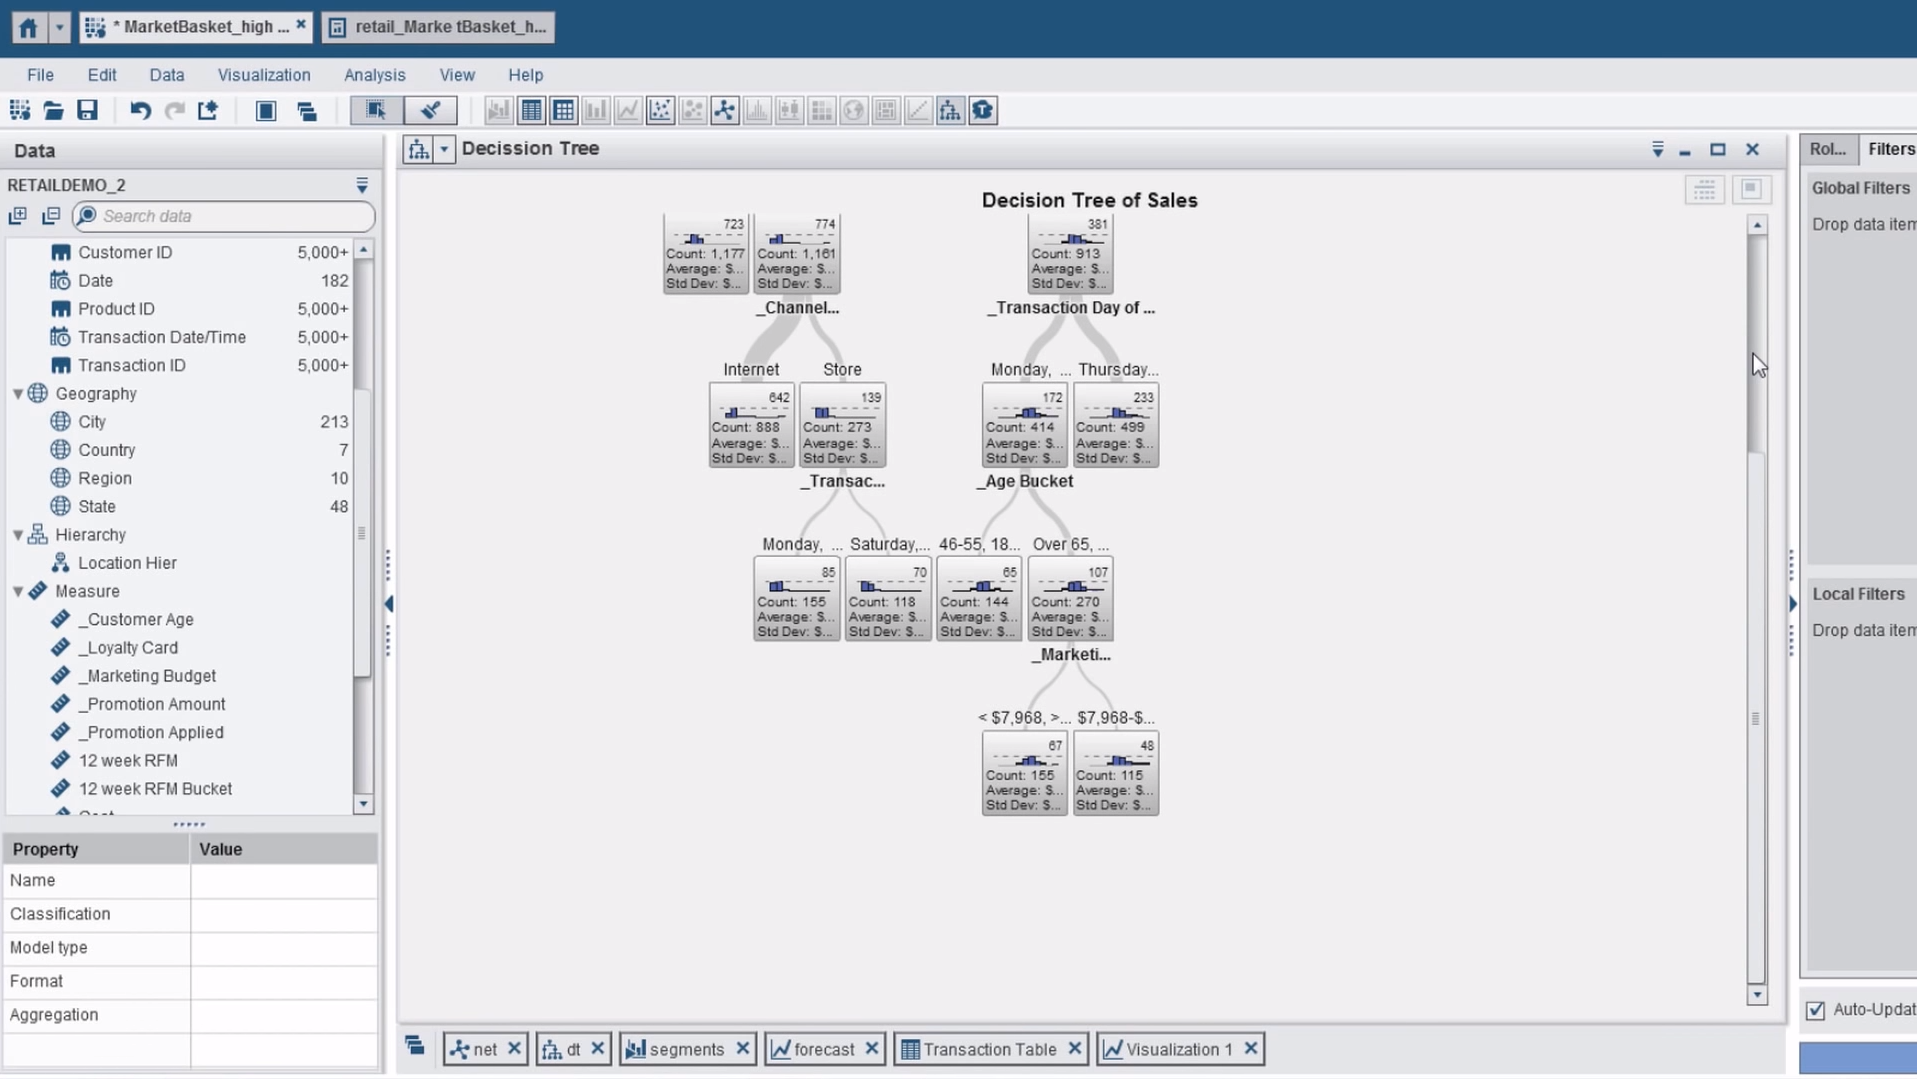
Another solution that is part of our top business intelligence software ranking is SAS Business Intelligence which is a suite of applications that empower organizations to prepare and display information for forecasting, text mining, data mining, predictive analytics, and statistics. With the software, users can quickly gain relevant insights using automated evaluations backed by machine learning with easy-to-digest natural language explanations.
As part of the SAS Enterprise Solutions suite, the software combines business intelligence and analytics to search and collect enterprise-level information. Similar to Power BI, SAS Business Intelligence also packs multifunctional modules which include the SAS Enterprise Server, SAS Enterprise Guide, SAS Office Analytics, SAS Visual Statistics, and SAS Visual Analytics.
Moreover, SAS Business Intelligence also offers flexible deployment options with its ability to operate in public or private cloud infrastructure, commodity hardware, and through Cloud Foundry platform as a service. Other than that, the software also streamlines business intelligence by digging deep into every information sources and avenues to pin down trends, recognize correlations, and discover outliers.
Dashboards and interactive reporting also help users to go immediately from exploration and reporting to evaluation and sharing information through different channels, including Microsoft applications with a unified interface. Speaking of Microsoft, SAS Business Intelligence also integrates with Microsoft Outlook and Excel to ensure smooth collaboration between team members and higher productivity.
Customer support for SAS Business Intelligence is also top-notch with users having access to a comprehensive knowledge base and ticket systems. The knowledge base boasts information and updates on the BI platform where users can find manual and technical details about the software.
Regardless of its robust customer support, SAS Business Intelligence does not offer profit analysis or online analytical processing. It also does not support hybrid cloud data sources. Still, innovative features such as location analytics, smart visualizations, and self-service data preparation make the software quite intriguing for interested users.
Pros:
- Comprehensive Reporting
- Self-Service Querying of Information
- User-friendly Interface
- Seamless Data Access
Cons:
- Needs to Improve Drill-Down Plugin
- Lack of Integrations with Open-source Applications
- Too pricey
- Cumbersome Software Setup
SAS Business Intelligence Features
- Analytics and Insights
- Collaboration Tools
- Data Visualization
- Self-Service Business Intelligence
- Mobile BI and Reporting
- Text Analysis
- Location Analytics
- Multiple Deployment Options
- Mobile Apps
- Dashboards
- Customer Support
- Third-Party Software Integrations
- Detailed Documentation
- Text Mining
- Predictive Analytics
Point of Comparison
It is easy to get overwhelmed when choosing a business intelligence solution, most especially if your choice boils down to Power BI and SAS Business Intelligence. Both solutions have extensive features that illustrate business information through attractive yet interactive reports. Keep reading our Microsoft Power BI vs SAS Business Intelligence comparison guide so that you can pick a solution that scales with your current and future business needs.
Pricing
Pricing is one of the most common objections of customers when purchasing a business intelligence solution. This is because business intelligence solutions are almost always expensive, which goes against the grain of organizations trying to save money. It should be noted; however, that price shouldn’t be the point in the selection process, but rather the conversation should be about the value a solution brings to your operations.
Power BI offers two pricing packages which include the Power BI Pro and the Power BI Premium. All pricing plans include content creation monitoring, data security, encryption, reports, dashboards, data visualization tools, and complete access to a library of Power BI and the custom visual SDK.
The Power BI Pro which starts at $9.99 monthly per user also includes collaboration, publishing, and sharing tools while the Power BI Premium which sports advanced deployment and administration controls, a dedicated cloud computing, and storage resources is pegged at $4,995 monthly. The Power BI Premium can also be added to any Power BI Pro deployment, which makes the software quite ideal for companies handling big data.
Meanwhile, SAS Business Intelligence does not provide their pricing packages publicly, but interested users may ask for a quote, demos, or even free trials to get started. The pricing quote will also include free training and dedicated customer support to help non-technical users get comfortable with the solution. Price-wise, it is relatively challenging to pick out a winner between the two. Still, we give a slight edge to SAS Business Intelligence because it can be customized to fit your business needs which could provide value to your operations in the long-term if done right.
Ease of Use
Ease of use is almost always the second deciding factor in choosing a software solution, and SAS Business Intelligence has got it in spades. Its main module, the SAS Visual Analytics, makes it easier for users to create interactive dashboards and reports by querying and preparing information from multiple sources to identify essential relationships, clusters, and outliers.
It also comes with easy-to-use predictive analytics that allows users to quickly evaluate possible outcomes to make better data-driven decisions without programming. Best of all, SAS Business Intelligence also reduces experimentation and helps you get directly to analyzation thanks to its smart and straightforward algorithms and visualizations.
On the one hand, Power BI is also easy to navigate, though, it may require new users sufficient time to get the hang of the solution. This is because it might be challenging for users to understand the exact components they need with several modules available. In short, you may have to spend a large chunk of time figuring out what each part does with so many moving components to this solution.
Despite its challenges, users who can get accustomed to the complex processes of Power BI may find the software of value in the long term considering that it has extensive database connectivity plugins. That said, SAS Business Intelligence still takes the cake in terms of ease of use with its flexibility to be deployed on-site, on public and hosted clouds.
Key Features
Power BI and SAS Business Intelligence both have exciting features that could complement your business operations. The former is packed with 16 unique chart types for report visualization not to mention multiple third-party integrations with popular solutions such as Microsoft Dynamics, GitHub, Google Analytics, Adobe Analytics, and Microsoft Excel.
Power BI also offers a wide range of database connectivity capabilities for easier deployments on the cloud and on-premise. Its drag-and-drop feature is also a hit thanks to its ability to allow users to interact quickly with their data and spot trends. While Power BI does not have all the bells and whistles that its competitors have, it is still relatively promising considering that Microsoft is always investing resources into it to create advanced features.
Not to be outdone is SAS Business Intelligence which provides self-service data preparation tools to allow users to import their information, merge tables, and employ data quality functions with its drag-and-drop plugins. Besides that, the software solution also offers users with smart visualizations to ensure that data is presented in the most compelling way possible.
Dissimilar to Power BI, SAS Business Intelligence uses guided analysis and advanced data visualization techniques through auto-charting to make sure that visualizations are interactive and accurate while minimizing the time spent for experimentation. You can compare data visualization software capabilities of both solutions here to see the best fit for your organization.
So Which Is The Best?
Highlighted in this Microsoft Power BI vs SAS Business Intelligence comparison article were its benefits, pros, cons, and features. While both solutions may present a compelling argument of being better than the other, the choice of the right business intelligence tool ultimately boils down to the needs of your business.
Power BI works well with the everyday business users thanks to its ability to seamlessly convert business data into attractive and simple visuals in seconds. For mid-size businesses to enterprises, opting for SAS Business Intelligence may be the sensible option considering that the software can be custom-tailored to meet your needs for growth and change.