Data is what makes the modern world go round. However, the process of collecting, analyzing, and visualizing data can be time-consuming and complicated. Doing it correctly can spell the difference between successful and costly business decisions. This is why many companies nowadays utilize a business intelligence (BI) software to reinforce their data analysis efforts.
By having a BI tool in your arsenal of business systems, you can easily gain insights into your daily operations. These often come equipped with data management systems, predictive analytics features, as well as data visualization options. As a result, seasoned business analysts and entrepreneurs who have no experience with analytics can easily make sense of business data and eliminate the guesswork in the decision-making process. These tools can be complemented with human support such as virtual assistants who can add further ease to your daily operations.
To help you further understand business intelligence software, we will be tackling different topics surrounding this technology. From how it works and the key features of these tools to the benefits of having these systems and the types available on the market, we will provide you with everything you need. We have also listed down some of the leading BI software providers today so you can easily zero in on which tool will work best for your company.
What is Business Intelligence Software?
Business Intelligence (BI) software helps users gather, curate, and analyze data to generate actionable insights that can optimize the health of their businesses. The software includes features that measure, compare and create custom relations among a wide range of data set. Thus, users employ BI tools for data discovery, management, reporting, and analysis.
What’s more, there are also specialized BI platforms that can evaluate employee and marketing performance. Some even use these systems to track and react to competitor activities. Essentially, business intelligence software programs let you track, gather, analyze, and manipulate information, plus offer data-driven insights that can help you move your business forward in the best direction.
Lastly, the best platforms out there offer real-time data gathering, manipulation, and insights.
How Business Intelligence Software Works
In a nutshell, business intelligence tools allow users to collate data from disparate systems. For instance, you’d like to check if there is a correlation that points to plausible causation between lead generation, employee productivity, and profit. You use business intelligence software to search for this data within your organization and cross-tabulate them. In this way, you can see how they are related and start to figure out whether one input helps maximize the output of another.
To wit, the best BI software systems help you gather these data easily by integrating with or working together with other business systems. They also allow you to connect to real-time data for quick real-time analysis.
Also, BI programs are fitted with visual reporting tools in a highly-intuitive yet powerful interface. These allow you to generate insights faster and easier — no more fumbling over spreadsheet commands and formatting. BI systems let you set up an easy analysis workspace with drag-and-drop ease. Moreover, they can automatically render complex business data into charts and graphs for easy representation.
These tools make it easy for a business to create predictive scenarios, historical analysis, and conduct multivariate testing.
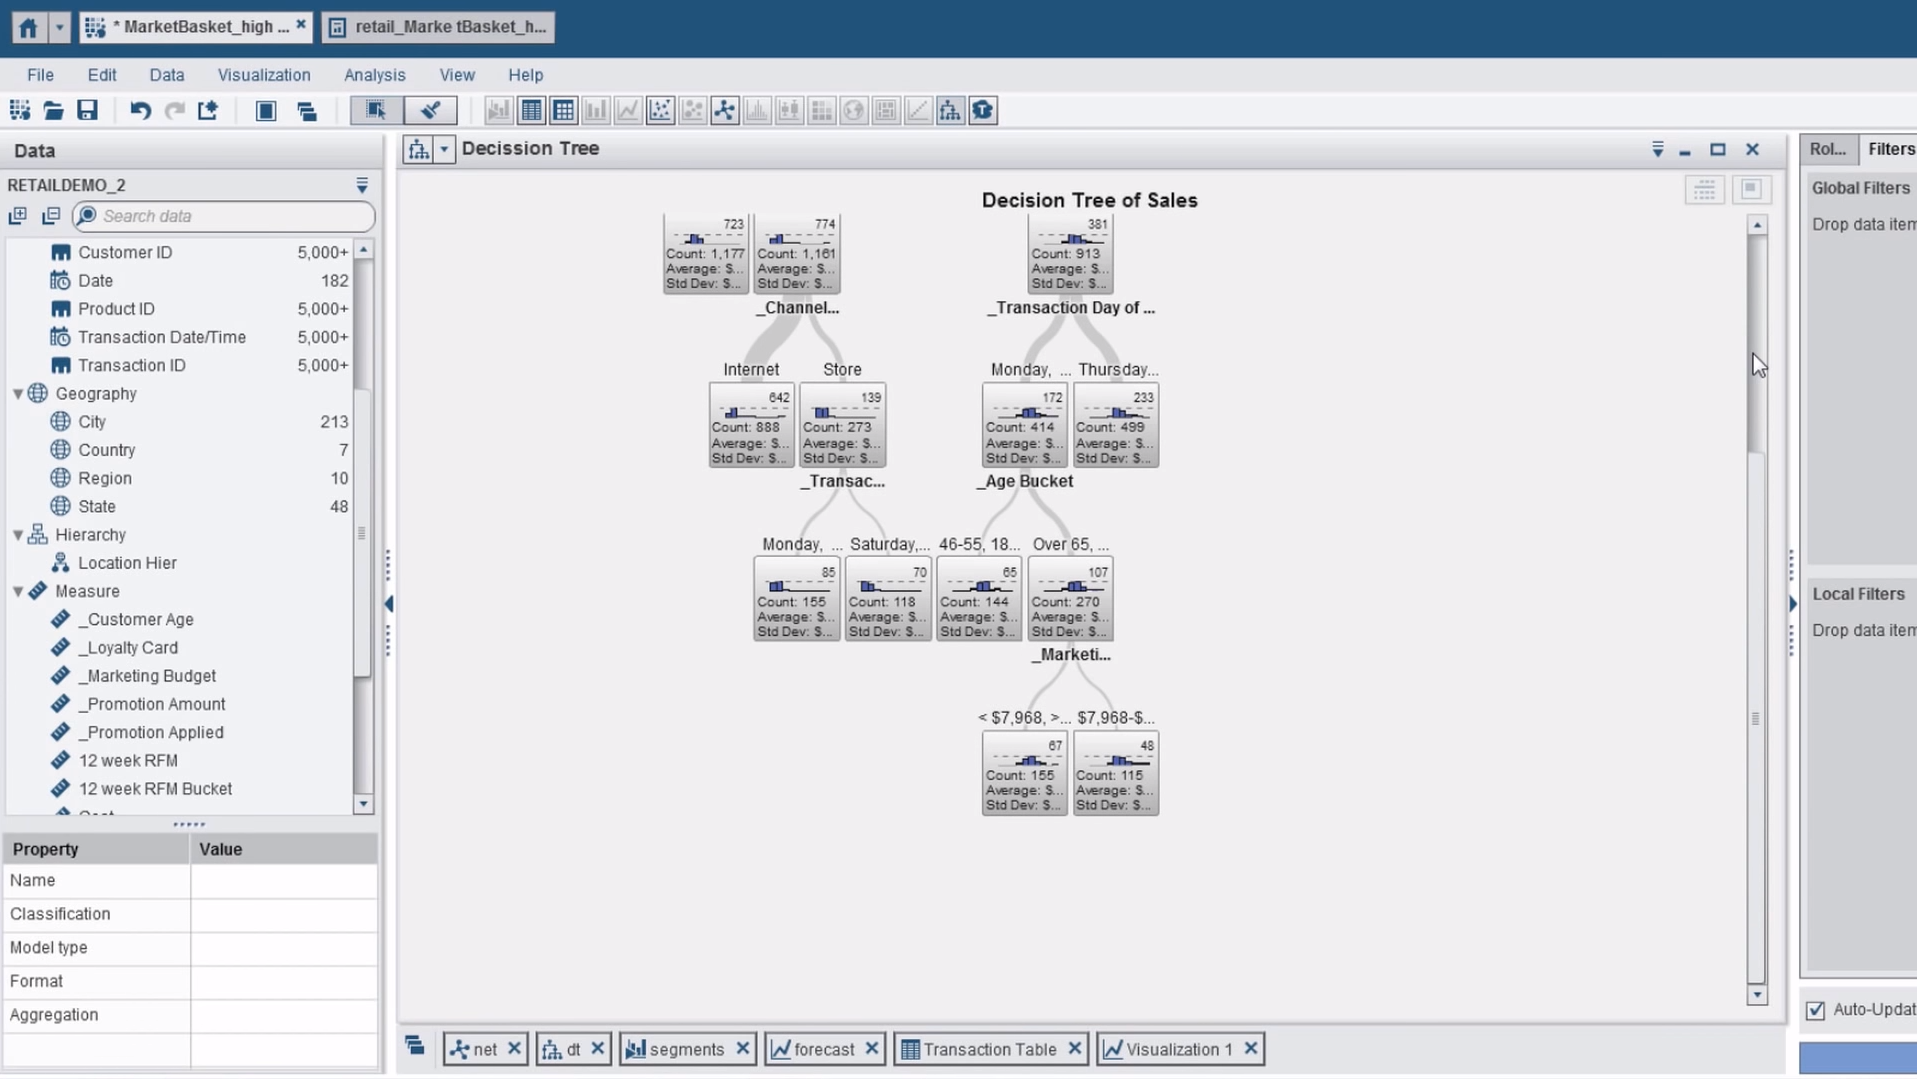
SAS Business Intelligence offers several features that will help users gain in-depth insights into their company data.
List of Best Business Intelligence Software
There are systems sitting at the top of the BI software heap. Let’s take a quick look at each of their unique selling points, ideal users, core features, and starting prices.
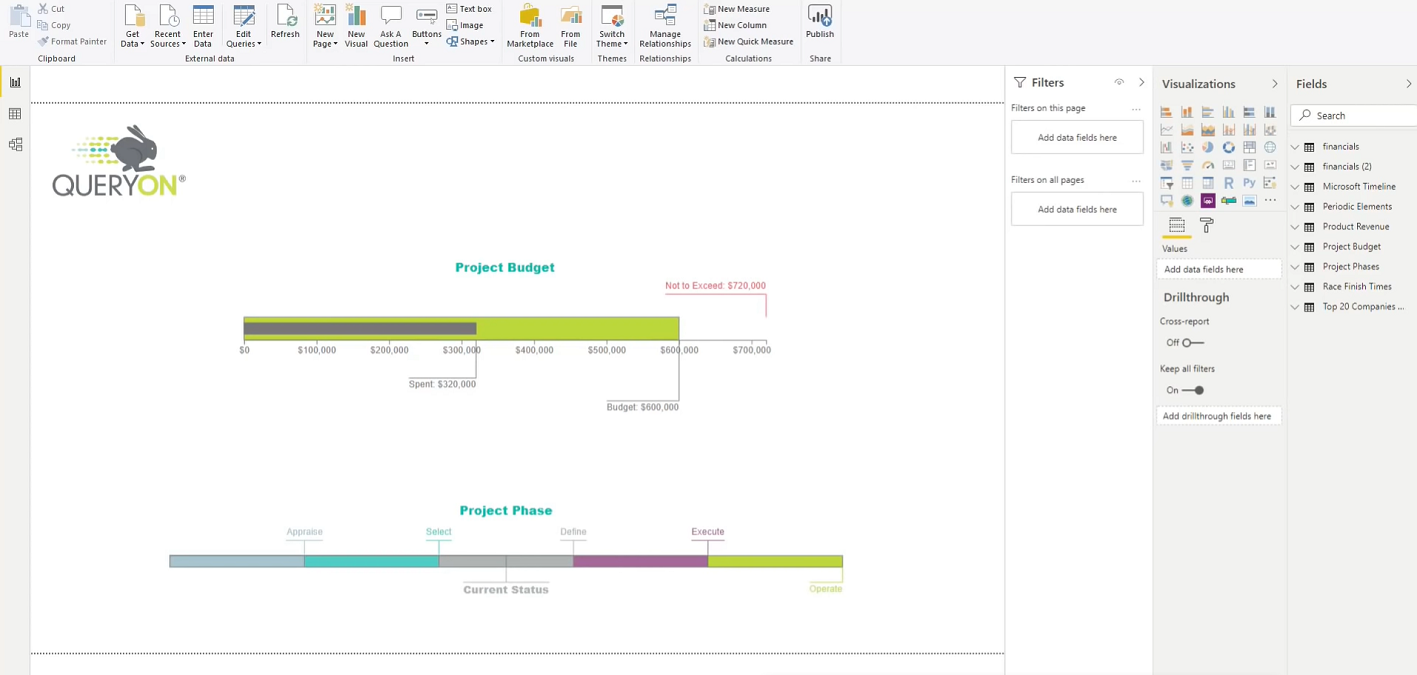
- Datapine: A data visualization tool with powerful BI features. Through its highly-visual and interactive dashboards, it helps companies extract relationships and generate insights from their raw business data. This enables them to make smarter business decisions and develop a reflective and self-corrective culture. In case you’re interested, Datapine offers its program by quote.
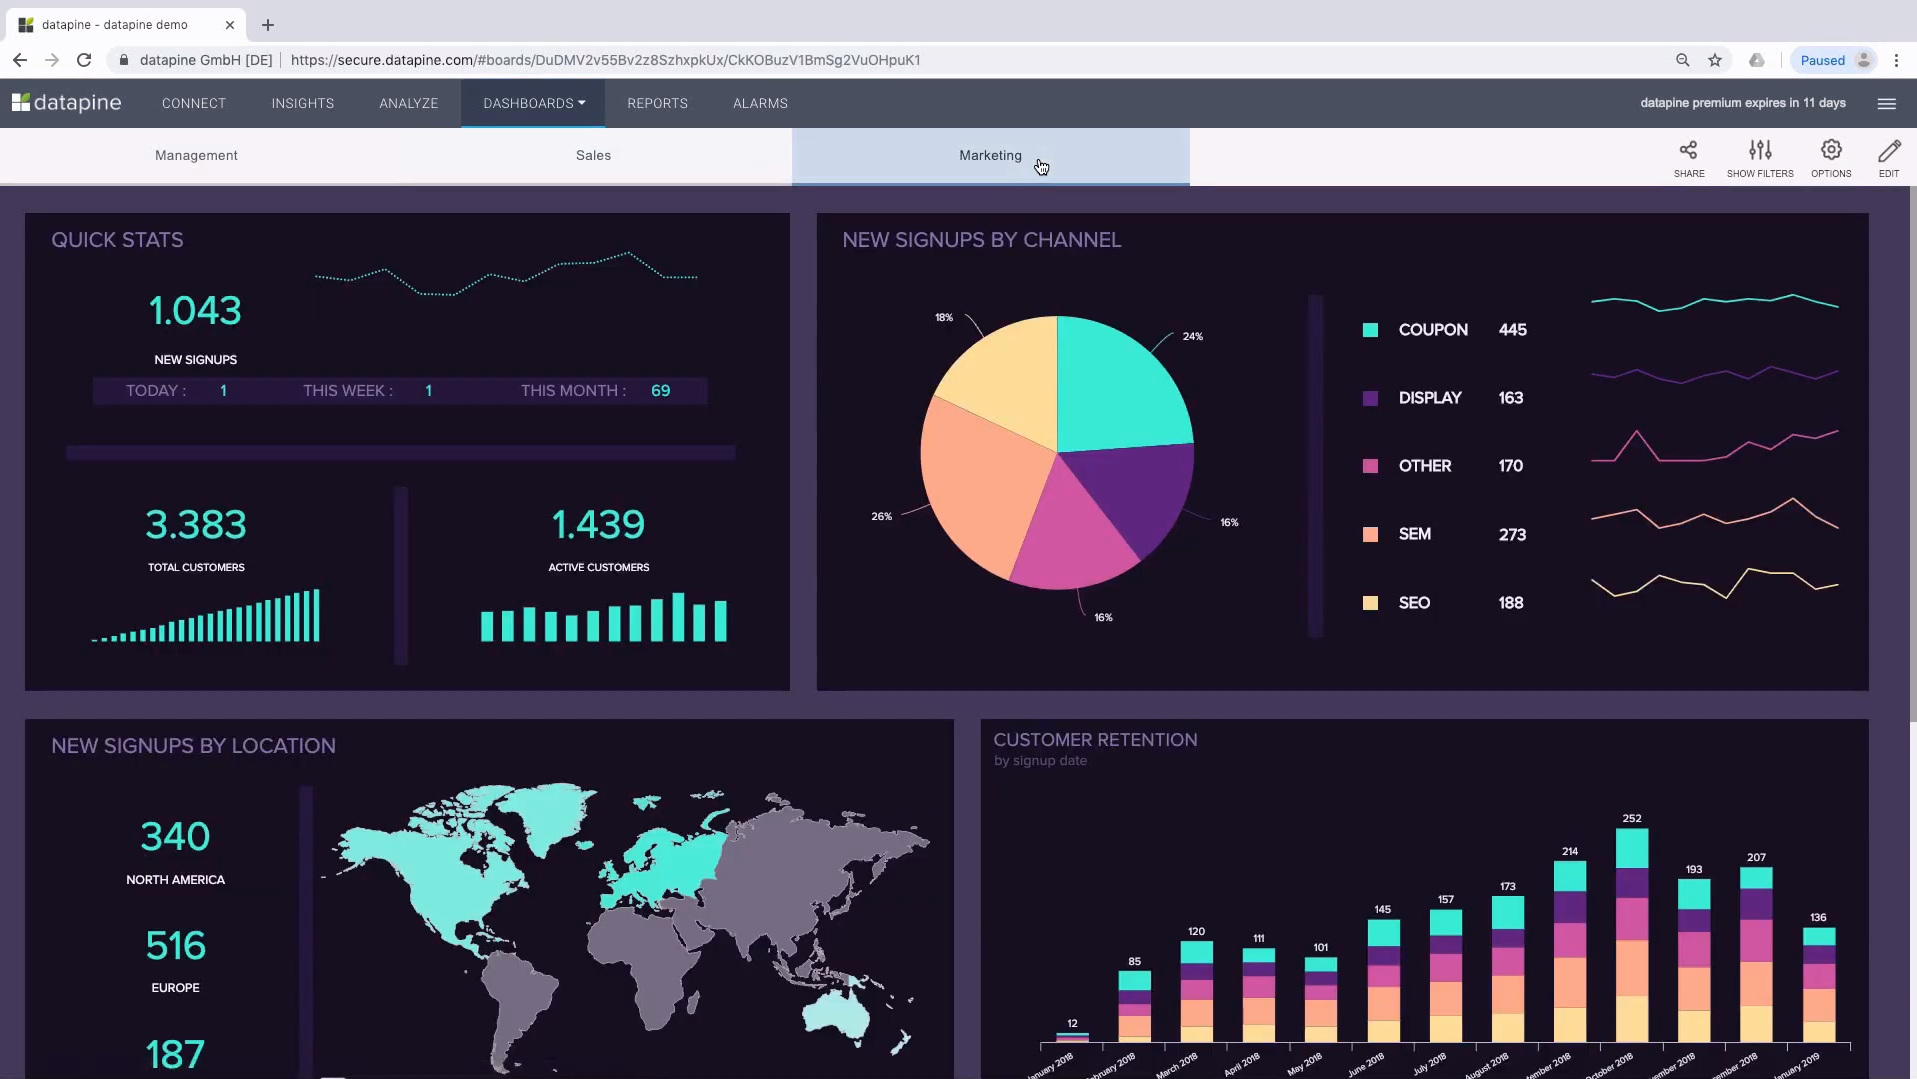
Datapine is a leading business intelligence tool because of its comprehensive tools and easy-to-use interface.
- SAS Business Intelligence: A powerful application that makes complex BI and analytics processes easy even for software novices (but analytics-informed). It lends mighty computational power to its clients in a very user-friendly interface that is equipped with visual analytics tools, data exploration options, and more. For pricing, SAS Business Intelligence is available by-quote, but its known starting price is at $9,000 per user per year.
- IBM Cognos Analytics: An easy-to-use BI system that is fully self-service. Its highlight is its highly-intelligible and easily-customizable dashboards that users can create on their own. IBM Cognos Analytics dashboards are also interactive and shareable for easier distribution. Core features include automatic visualizations, offline availability, and a smart search engine that works using context. The program is priced starting at $1,990 a month.
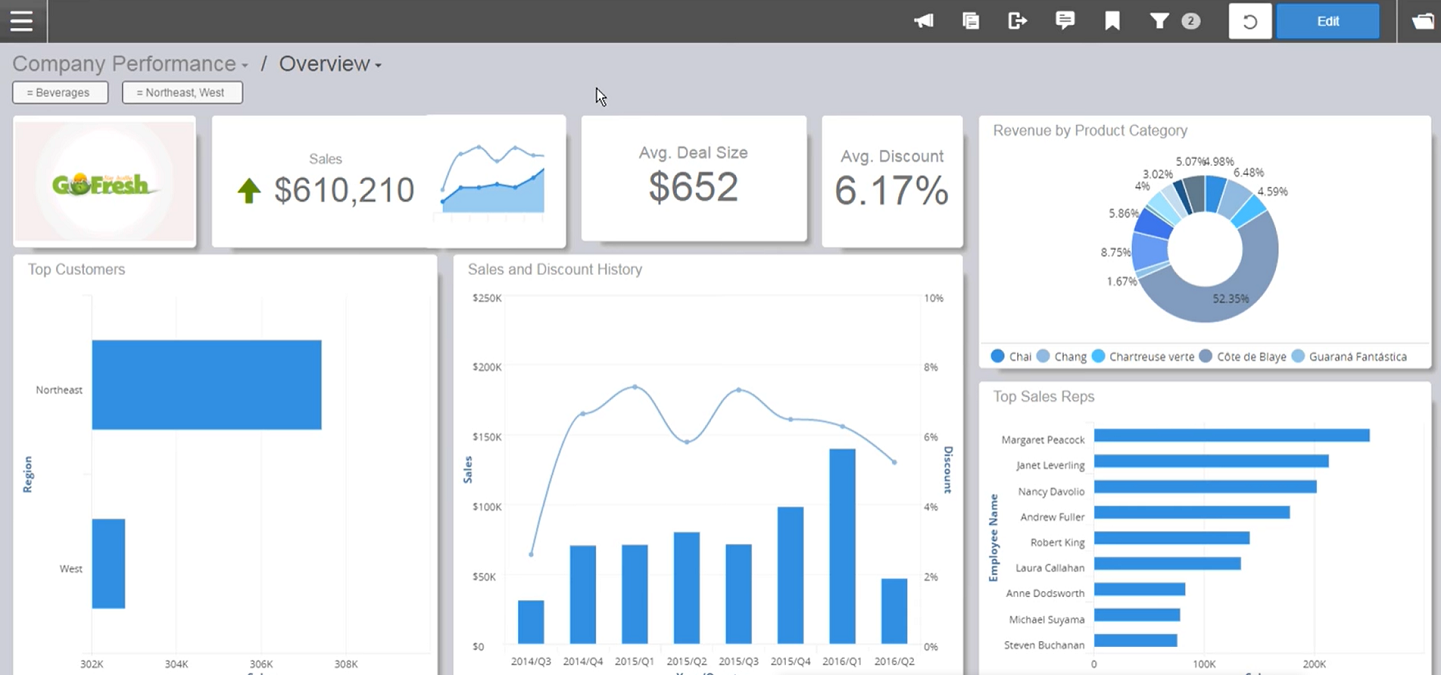
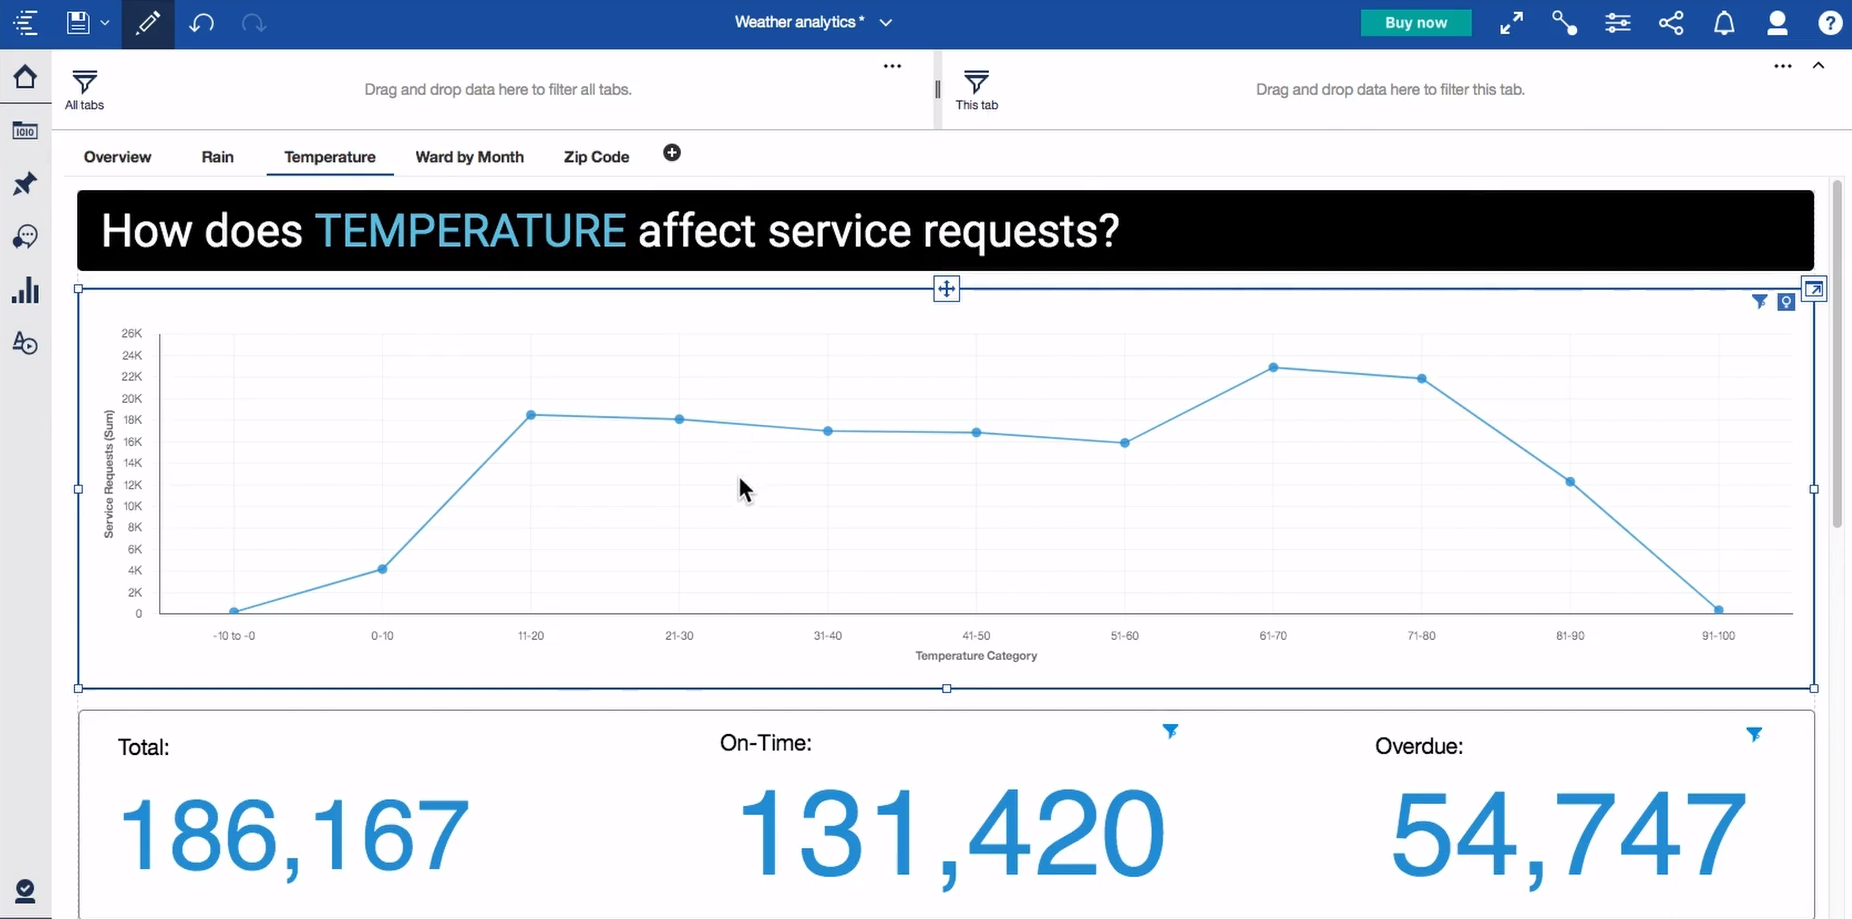
- Tableau: Tableau is a popular BI system for large and medium enterprises. However, it has versions that can be deployed by individuals and small businesses as well. This comprehensive software suite is made for easy collaborative business intelligence gathering and analytics. Core features include native data connectors, dashboard commenting, data sharing, interactive dashboards, metadata management, embeddable dashboards, and data storytelling. Tableau pricing starts at $12 per user a month.
- Sisense: Sisense is inarguably one of the best BI and analytics providers in the market today. Trusted by medium to large enterprises, it helps users integrate seemingly disparate data from different sources and of varying file types. Thus, it provides businesses with the power and flexibility to bring data to bear on its operations. Core features include data connectors, visualizations, scalable analytics, and real-time dashboards. Sisense is available by quote.
- Domo: A highly flexible self-service business intelligence tool built for businesses both big and small. It comes with an easy-to-use interface complete with data connectors, dashboard widgets, interactive data visualization options, and mobile-ready functionalities to help you with your BI efforts, wherever you may be. In addition, it comes with modules for collaboration and project management to further streamline your operations. For pricing, Domo is only available by quote.
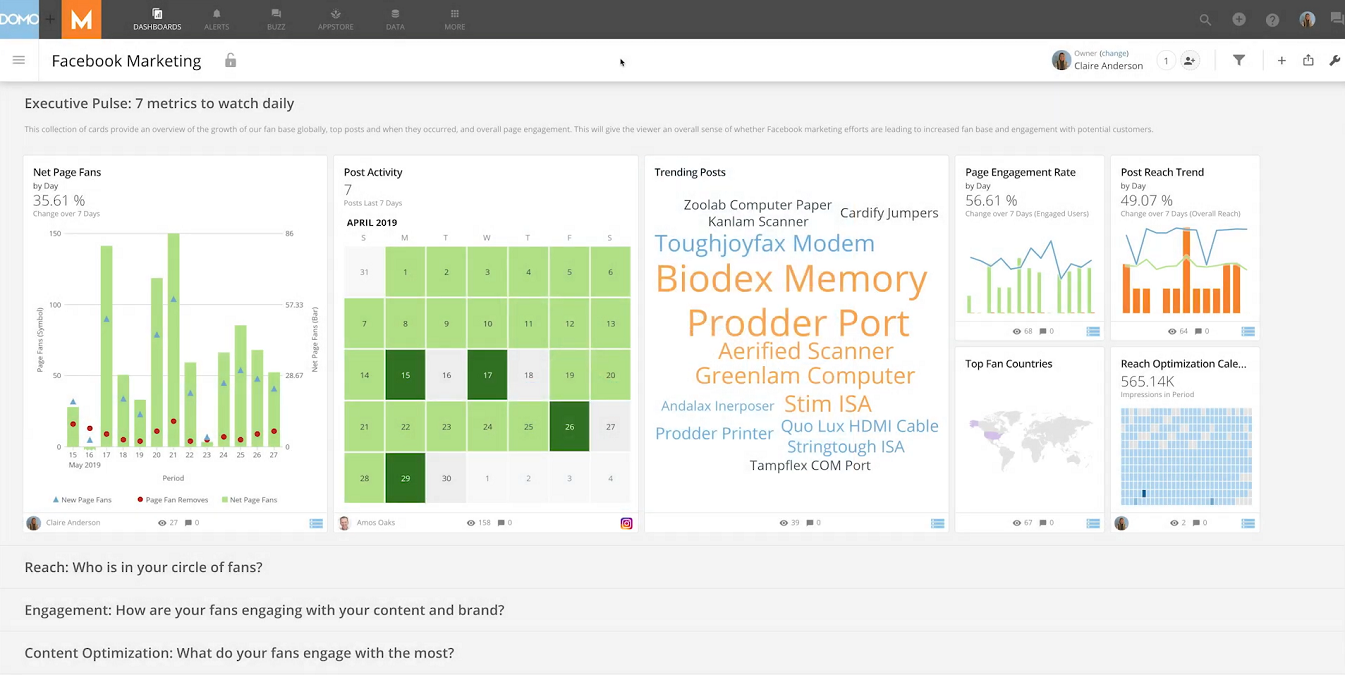
Domo has a flexible yet simple interface that makes it ideal for tech-savvy and tech-averse users alike.
- Qlikview: Primarily a data discovery tool for all company sizes, this can be used for BI with its guided analytics features. Moreover, it comes with an associative data indexing engine so that users can easily pinpoint patterns in their data to make informed business decisions. Other features include data visualization, smart search, custom reporting, and custom data connectors. For pricing, the basic plans of QlikView are available for free while the rest of their packages are only available by quote. They also have a cloud-based tool for businesses, which starts at $15 per user/month.
- Looker: This is a popular data discovery application equipped with fully customizable reports, real-time data exploration, collaboration options, and modern IDE. It can support SQL codes but it also comes with drag-and-drop tools for users with no prior BI experience. Another great thing about Looker is that it’s completely browser-based. Meaning, you can access it anytime, anywhere, on any device you prefer. In case you’re interested, Looker’s plans are available by quote.
- Birst: This cloud-hosted BI tool is created for companies with production-oriented processes. It leverages a two-tier approach using a slew of functionalities, ranging from data collection and visualization to automated data refinement and predictive analytics. What’s more, it can support custom reports so you can easily create reports however you prefer. It can also integrate with a variety of other systems so consolidating data from multiple software is as easy as possible. In case you’re interested, Birst is available via quote so be sure to get in touch with the vendor for details.
Birst comes with a customizable dashboard so you can create your company reports however you prefer.
- MicroStrategy: MicroStrategy is a full-featured BI solution that comes with its own agile analytics module, custom reporting tools, enterprise-grade security options, and native mobile applications. With this at your disposal, you can easily gain insights into your day-to-day operations. What’s more, it comes with a What-You-See-Is-What-You-Get (WYSIWYG) dashboard so you can be sure that it’s easy to learn even if you don’t have extensive experience with business intelligence or analytics. MicroStrategy’s pricing plans start at $600/user. This is for their web package. They have three more packages depending on the features you need.
- Yellowfin: Perhaps one of the most popular BI tools on the market, this end-to-end analytics product provides actionable insights and data-driven predictions to help companies improve their overall operations. It comes with not only data governance, preparation, and transformation tools but also advanced features such as machine learning, data storytelling, and collaborative BI. To top it all off, it has web API capabilities so you can connect it with virtually any other system you have in your arsenal. For pricing, Yellowfin offers different pricing packages depending on what modules you require. Their plans start at $10/user/month.
- Zoho Analytics: Formerly known as Zoho Reports, this tool is equipped with a self-service BI system, data analytics, and online reporting. What makes it unique is that it offers drag-and-drop editors, dynamic filters, and chart templates. These make it pretty easy to learn and implement for novice users. For pricing, Zoho Analytics has a free plan that is ideal for small companies with minimal BI requirements. However, if you require something more advanced, they have paid plans starting at $22.50/month.
- Oracle BI: This business suite offers end-to-end enterprise performance management that simplifies the process of making data-driven business decisions. It comes with various tools, such as data warehousing options, advanced analytics tools, and financial performance management. Moreover, it is mobile-optimized and comes with voice search support. This way, you can get answers to your questions whenever, wherever and in the easiest way possible. Oracle BI is available starting at $150/month/user.
- Qualtrics Research Core: A platform primarily designed for market research, this tool is used by different companies to drive better business decisions. Like other BI tools, it offers data management, segmentation, and analysis. However, it also offers survey tools, concept testing options, perception and awareness analysis, and competitive benchmarking tools. With this, you can get a more comprehensive view of your overall business performance and take the guesswork out of managing your company. Lastly, Qualtrics Research Core is available for free.
- Microsoft Power BI: A business analytics suite built with medium-sized companies and large enterprises in mind. It is equipped with ad hoc reporting, online analytical processing, interactive reporting, and customizable dashboards. Furthermore, it comes with a powerful visualization tool that simplifies the creation of engaging and comprehensible reports. For pricing, Microsoft Power BI offers a free plan for small teams with basic analytics requirements. However, if you need something more advanced, they have a paid plan that costs $9.99/user/month.
Microsoft Power BI is a robust system that can consolidate, process, and visualize various types and volumes of data.
Business Intelligence Software Key Features
There are many kinds of BI software systems. Some cater to a general need by being customizable and flexible. Others serve special purposes like text analysis. However, there are key features that every BI software has to have, and we will be detailing each one here:
Data management and search
BI tools allow you to store, organize, and search for data easily. In this way, you can safely store sensitive business information and access it anytime you need them.
Online analytical processing (OLAP)
These tools form the core of BI systems. This multidimensional analysis tool helps users plan and analyze business decisions and policies. It has a wide range of uses, from trend analysis in sales and marketing to simulation models in agriculture. Commonly available analysis tools in BI systems, include A/B testing, multivariate analysis, and pivot tables.
Predictive analytics
This is all about getting forecasts and simulating future scenarios given particular interventions. There are many techniques for these, including machine learning. Simply put, BI platforms offer a predictive analytics module to help you contemplate possibilities and even simulate outcomes.
Visualization dashboards
Good BI systems have highly-visual and easy-to-understand controls for dashboard creation. Dashboards serve as windows to some facets of your operation and their interoperability. These are usually set up so you can see changes and updates in real-time. Moreover, you can also connect this to your mobile device for push notification.
Interactive reports
Analysts, traditionally, have a hard time getting their data and concepts across. Today, with the help of BI systems, they can send reports that are not just highly-visual and beautifully-designed, but also interactive.
We suggest that you use this key features as points of comparison when choosing the right BI software for you. Also, you have to know the benefits that you want to accrue over time.
Benefits of Business Intelligence Software Systems
The specific benefits that you gain from using BI software tools depend upon how you use it. However, there are general ideas about why a business today needs to adopt a BI solution. Here they are:
Collate and aggregate data from disparate business areas and systems
BI tools usually integrate well with other business platforms. Thus, it allows users to pull data from different systems across your chain of operations. In this way, you can analyze how each process contributes to your key performance areas. For instance, you can use the BI tool to extract financial insights in terms of ROI about your social media campaigns. No more copy and pasting to and from spreadsheets to collate your data. The BI system does all these for you. Furthermore, it can automatically visualize them with a wide array of representation choices.
Historical analysis of business data
BI software provides businesses with different ways to measure past performances. With them, analysts and executives can dissect, which processes can be improved and what optimization policies should they make. For example, analysts can take a look at past data to find relations that could be potential causes for a slump in sales for a particular month. In this way, BI systems benefit businesses by giving them a chance to course-correct.
Predictive analytics and forecasting
The ability to analyze historical data provides another use — allowing users to forecast and make predictive models of plausible scenarios. This is not only great for making future decisions. It also provides users with information on how to optimize current operations. For instance, you can get analysts to provide marketing insights on how to go about your next campaign based on past successes and failures.
Clear and accurate reporting
BI tools allow you to handle large complex business data accumulated throughout the years. It makes these data highly interpretable thanks to a variety of visualization and analytics techniques. Also, what’s great about this is that dashboards and reports are usually very shareable as well. Moreover, they can be shared in different formats, from interactive HTML to .csv files. This allows businesses to share highly-valuable intelligence to all its departments and personnel. Thus, when done correctly, companies can have a shared vision and goals.
Types of Business Intelligence Software
In this section, we’ll discuss two different classes for BI software types. The first class is the deployment-type, and the other is the function-type. The former is classified by how it is deployed, while the latter is classified according to its main function.
Three BI Deployment Types
The three types of deployment for a BI platform is (1) on-premise, (2) cloud, and (3) hybrid.
The on-premise deployment-type is a traditional software system that you have to install on the machines that you intend to use. The benefit of this is you don’t put your intelligence processes in jeopardy by making them primarily rely on your internet connection or your provider’s service uptime. You keep your files and dashboards locally. The downside is that they require better and faster hardware to run well.
Meanwhile, cloud deployment-type systems are software-as-a-service (SaaS) products. You access them via the internet and outsource computational power to your provider. This means you don’t have to invest in expensive and powerful hardware. Also, this includes storage. However, you get your BI processes to fully rely on your internet connection quality and service uptime.
Lastly, systems also use a hybrid deployment where you have an on-premise client application and even a SaaS to boot. This, in principle, is safer than the two other types as you spread the risk of losing your intelligence assets or valuable uptime. However, this can be a bit pricey. But, many platforms offer this type of deployment at very competitive prices.
BI Types Based on Function
As for the function-type, There are three types of BI systems for three different yet very related processes.
Data management
Many BI platforms are used to primarily clean up and organize your raw business data. They can index and archive files, sheets, and information for better search in the future. Moreover, these types of BI systems follow what’s called the ETL process (extract, transform, and load). They gather target files and information for further processing and analytics. Also, they could apply this to different sources, such as data warehouses, data containers, and, of course, good old spreadsheets. Also, other platforms even collate data from website content, reports, and mailing lists, among many other sources. Additionally, top BI systems include this as a major feature.
Data discovery
This is the main feature for most top BI software. These types of platforms allow users to extract insights from raw data using different analytics tools. The come-on of this type relies heavily on how it can turn raw business data into an intelligence asset for better decision-making. They use tools such as a relational database, the aforementioned OLAP, predictive analytics, and even semantic analysis, among many others.
Reporting system
Many BI tools are primarily visualization and reporting systems. They commonly feature interactive visual reports that are shareable and customizable. However, most top-flight BI systems have built-in reporting modules already. These are used to automatically generate reports complete with interactive graphs and charts useful in all types of business areas. They help represent KPIs and other metrics visually yet retain its measurable quality with numerical values.
It is important to note that these BI software types may exist together in one suite. Top platforms have modules for each one of these. Some just have these built-in for a comprehensive deployment. Many, if not most, BI software providers, however, offer different modules separately and their features in pricing tiers.
IBM Cognos Analytics is a self-service BI tool that can support both on-premise and cloud-hosted deployment.
Latest Trends in Business Intelligence
Experts predict that the BI and analytics market to reach a value of $26.78 billion in 2020. When combined with big data, the expected value of the market is $54.1 billion in 2022. What these projections point to is a big hike in the adoption and production of these software services. One interesting bit is that organizations with about 100 employees that have shown the highest BI penetration rate.
Also, In BI and analytics practice, we have seen data storytelling take a central role. This is because more and more businesses understand that bare statistical facts and data don’t really tell a story. They need a narrative scaffold and a process framework to make sense of them.
In science, explaining old and new facts, plus predicting novel behavior, is a job done best by theories. In business, the best theories, in a sense, come in the form of stories that analysts and executives weave around data. Analytics and BI are just how we curate and employ facts to approximate relationships and future scenarios. This scientific approach to going about business is likely to pick up more steam in the future.
Lastly, it is not just going to pick up steam in analyst and executive circles. The shareability of interactive dashboards allows for companies to build an analytics-aware culture across all departments. So, in the near future, we should expect all managers and most employees to be where the technologist and analyst hats in addition to their daily work.
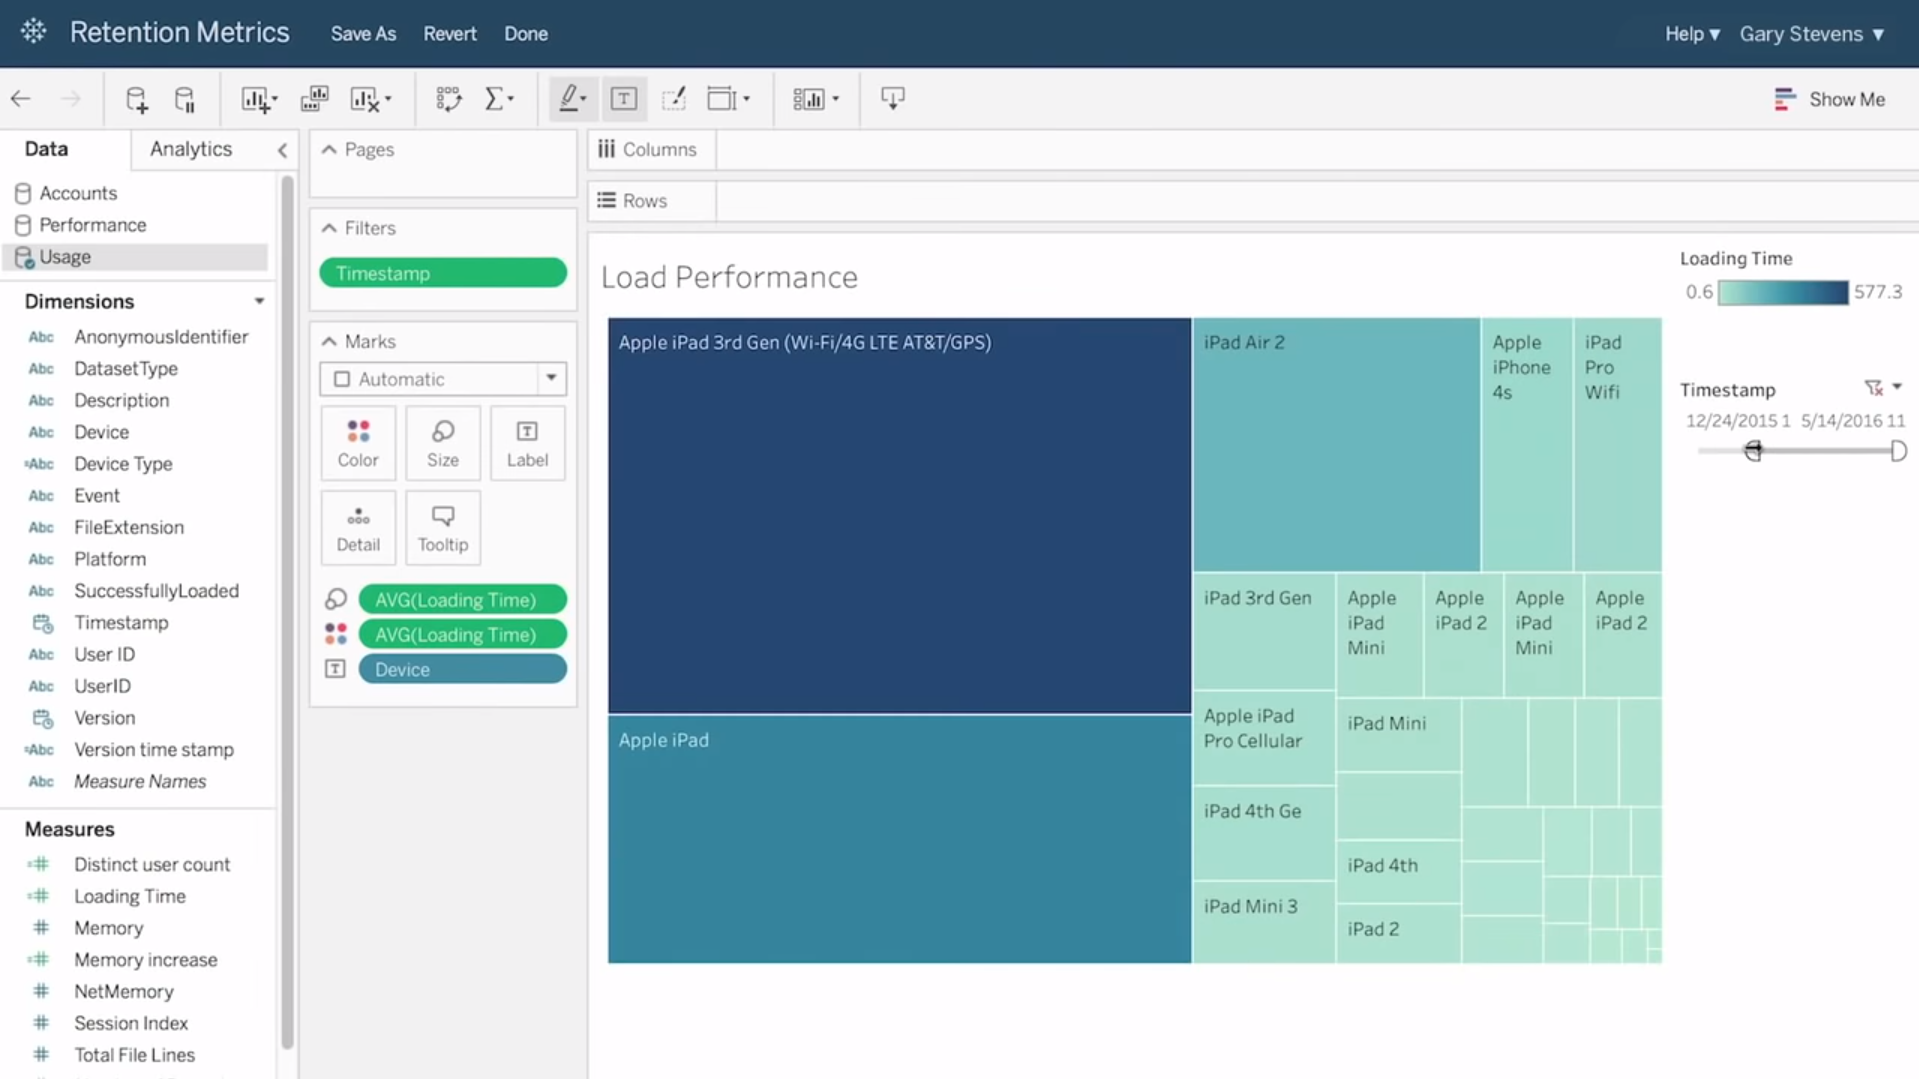
Tableau is an example of a BI system that updates regularly to make sure that you are always ahead of the curve when it comes to BI trends.
Potential Issues With BI Software
Of course, BI and analytics are a big boon to a company. However, having software tools isn’t a surefire way of gaining real benefits. There are prerequisites in the human side of the practice that can be a source of many potential issues.
Adoption
Digital transformation or the use of digital tools and digitally-enabled business processes to create a competitive edge is pretty hard to pull off right. One factor is the lack of proper adoption. Business owners or executives may have a shared vision with each other. Also, they may be aligned with middle management. However, employee culture can just be not ready for change.
Learning curve
Sure, BI platforms today are very user-friendly. However, they are not that easy to learn, especially for people with no background for or are not inclined to use statistical tools. The learning curve is not just about how to make the program execute what you want to do. It is also mostly about knowing what you want to do first. And, this is the hard part. Which brings us to the next item.
Bad data, bad philosophy
There is such a thing as data philosophy. It is the study of the existence, use, and implications of data or information for human affairs. One basic guiding principle among data scientists is “correlation does not imply causation.” However, new adopters to BI and analytics techniques often forget this basic wisdom and proceed with the inverse assumption. Couple this with using the improper data to back up stories or insights, you’d get into many complications. Biases influence analytics just like it influences other “rational activities,” such as theory-making in science.
BI software usage is not close to its potential
We already know that BI platforms are very powerful and flexible. Also, they are packed with advanced features that users don’t get to use. This is one loss for a business when a tool is not used to its potential. However, related to the previous two items, human creativity is also a factor when it comes to software use. When users are not familiar and, even, creative with statistical inference tools and data choice, they also limit the potential of their BI processes.
Factors to Consider When Choosing BI Software
Here are important factors to consider when you choose the right BI software for you.
Data connectors and exports
First, you have to find out what types of data the BI system you are scouting can handle. Of course, you should have this aligned with the data types your organization is using. Most top-flight software can handle a wide range of data from Excel files to HTML. However, you have to double-check and make sure.
Shareability, collaboration features, and interactive dashboards
There is little use for analytics confined in the ivory tower. BI is best shared with other individuals to get intelligence assets used in all corners of your organization. One way to do this is by using interactive dashboards. They are good for presentation and, also, for further tinkering.
Moreover, you should find a software solution that has collaborative features. The best BI and analytics work is not done in a vacuum. Collaboration guards for unhealthy biases when it comes to data choice, analysis, and building stories.
Data processing and analytics features
This is the meat of the matter. When you say BI, you mean processing and analytics. In fact, most BI platforms have fast, accurate, and simple to use analytics features. For this factor to consider, we suggest that you study first which inference tools you need and want to use for your firm. Once you already know, scout for programs that have the best modules and interfaces for those features. In this way, you’ll choose the right program for your operations and vision.
Ease of use
Nobody wants to code for a simple visualization, especially when you are not a coder. Businesses pay Analysts for their analysis, and frequent coding cuts down productive analysis time. So, if you want to bolster your analysts’ performance, you should choose a product for them that is so easy to use that they can do more of what they are trained to do. Also, be sure that the program is also pleasing to the eyes. You don’t want to work day in and day out with a love-hate relationship with your BI tool just because for aesthetics reasons.
Integrations
A good BI tool needs to gather disparate data from different sources and in different types. Nothing will have you do this with ease than a platform that seamlessly retrieves and processes data from your current information architecture. For instance, if you want to compare sales performance and inventory, it’s best to have your BI suite connect to your sales and inventory programs as well.

Sisense comes equipped with all the essential BI tools, making it an excellent option for novice and advanced BI users alike.
Try Out Some Business Intelligence Tools
So, there you have it, our two-cents about what business intelligence software is, how these systems work, and how you should choose the one that’s best for you. Of course, these are just general guidelines and suggestions. Still, the best way is to actually try all the solutions on your shortlist. In this way, you get to have first-hand experience and judgment on which one is best for you.