In this digital age, there are many ways for your business to thrive. Digital information, for example, is one valuable way you can use to determine whether your clients are satisfied and happy with what you offer.
These days, businesses rely on survey responses, demographic data, and click-stream data to analyze and obtain relevant information that can help increase their performance. However, for businesses to acquire these data effectively, they must make use of business analytics.
This article narrowed down the list of business analytics services that you can utilize. Two of the most popular and commonly used are Google Analytics and Microsoft Power BI. If you want to check out more options, here is a software ranking of the top solutions in the category. Let’s take a look at their similarities, differences, features, and pricing in this Google Analytics vs Microsoft Power BI Comparison.
Overview of Google Analytics
Google Analytics is enterprise-class web analytics, which allows you to measure your return on investment from advertising and social media websites and applications. Some known companies that use Google Analytics are Spotify, Airbnb, Dropbox, and Uber Technologies.
It is designed as a cloud-based solution for small to medium-sized businesses. It helps these businesses evaluate and improve their performance to increase product sales, deliver better content, and create more effective marketing strategies.
Moreover, this application imposes business intelligence standards that provide a variety of features for both traditional and mobile users. Also, its features and functionalities offer many benefits that can contribute to your business performance and success.
Pros:
- Free
- Provides real-time stats
- Customizable reports
- Easy to integrate
- Interactive documentation
Cons:
- The user interface is confusing
- Powerful but complex tool
- Reports are not reliable
- Requires getting used to
Overview of Microsoft Power BI
Microsoft Power BI
Microsoft Power BI is a business intelligence software created by Microsoft. In comparison to Google Analytics, Microsoft Power BI is a business analytics service, which offers interactive visualizations while providing a straightforward interface. It also provides business intelligence capabilities to help nontechnical users analyze, share, and visualize data quickly. Microsoft Power BI is used by companies such as Cimri, Making Waves, Zoopla, and GameDuell.
If you are familiar with Microsoft Excel, you will quickly familiarize the intuitive user interface of Microsoft Power BI. Also, its deep integration with other Microsoft Office tools makes it flexible and will only require you with little training.
Microsoft Power BI helps users track their business and provides fast answers through its comprehensive dashboards. Then, the collected data will be turned into attractive visuals, which makes it easier to organize and create effective strategies. Microsoft Power BI was built to help your business keep up with trends and lead your business towards success.
To know more about business intelligence, check this article to see our list of the top BI software.
Pros:
- Unlimited access to cloud data
- Provides interactive visualizations
- Immediate collaborations
- Access to a wide variety of learning materials
- Reasonable pricing scheme
- Unlimited connectivity
Cons:
- Limited sharing of data
- Only works best for Microsoft Excel users
- Not capable of handling large data sources
- Struggle in publishing reports
- Lacks customizing options
Google Analytics Features
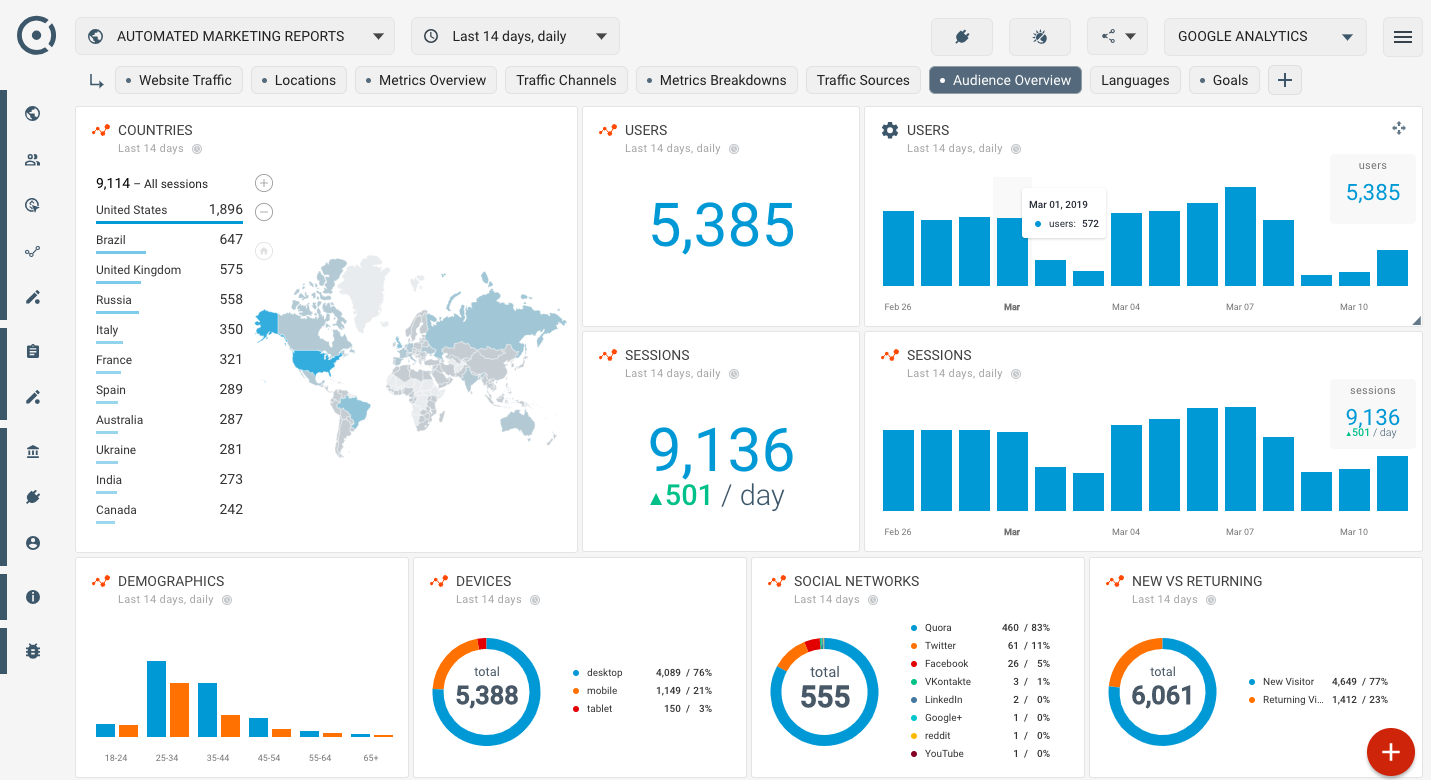
1. Dashboard
Google Analytic’s dashboard is composed of the essential widgets that you need to access and visualize your data quickly. You can create up to 20 dashboards and put 12 widgets in each of them.
What’s more about Google Analytics ‘ dashboards is that you can find examples of these dashboards and download them to your Google Analytics account. All you have to do simply click the link of the shared dashboard you desire and choose which property you want the dashboard to be put. This lets you save time and gives you more ideas on how to build your dashboard creatively.
Your data is still protected even you share your dashboards with other users. This is because Google Analytics does not allow other users to obtain your data once they download your shared dashboard configurations.
2. Reports
Google Analytics provides several report functionalities for its users.
Audience reports are provided by Google Analytics to know your clients or audience better. With this, a more colorful presentation of your audience is created. It provides you with your audience’s demographics, location, interests, and browsing behaviors. These give you a direct insight to gather essential data.
The most interesting part of the audience reports feature is the Interests section. This part lets you see what your audience is interested in as of the moment, which allows you to attract new clients.
Another functionality that Google Analytics provides is the custom reports. This allows you to customize your data depending on how you want. You can make reports for your business goals through Google Analytics’ custom report templates. You will save a lot of time with these ready-to-use report templates for the insights you wish to create.
3. Visualization
Flow visualization is also available when you use Google Analytics. This feature lets you see the visitors that opened and explored your website. Besides, you can quickly view how they engaged in your website’s content and their backtracks.
Also, the Flow visualization feature illustrates the path that your website visitors went through when they opened your site. From entering the website, engaging with the content, and exiting the website – flow visualization will show you everything step-by-step.
4. Goal tracking
Google Analytics enables you to track conversions and create something that you want your website visitors to interact with. This can either be signing up for email lists, filling out a form, a quick survey, or requests for a product demo.
Under that goal tracking features are website conversions and user activity. First, you must choose a particular goal for your page. Then, Google Analytics will follow each step made by your visitors. Every time a user completes the goal that you set, it is considered as a conversion.
Your goals can be categorized as:
- Destination – which is the path you want your visitors to make.
- Duration – which is the session or amount of time that visitors spent on your website.
- Screens per session – which is the number of pages that your visitors used per session.
- Event – which is the action that visitors do to your website: also known as “clicks.”
Microsoft Power BI Features
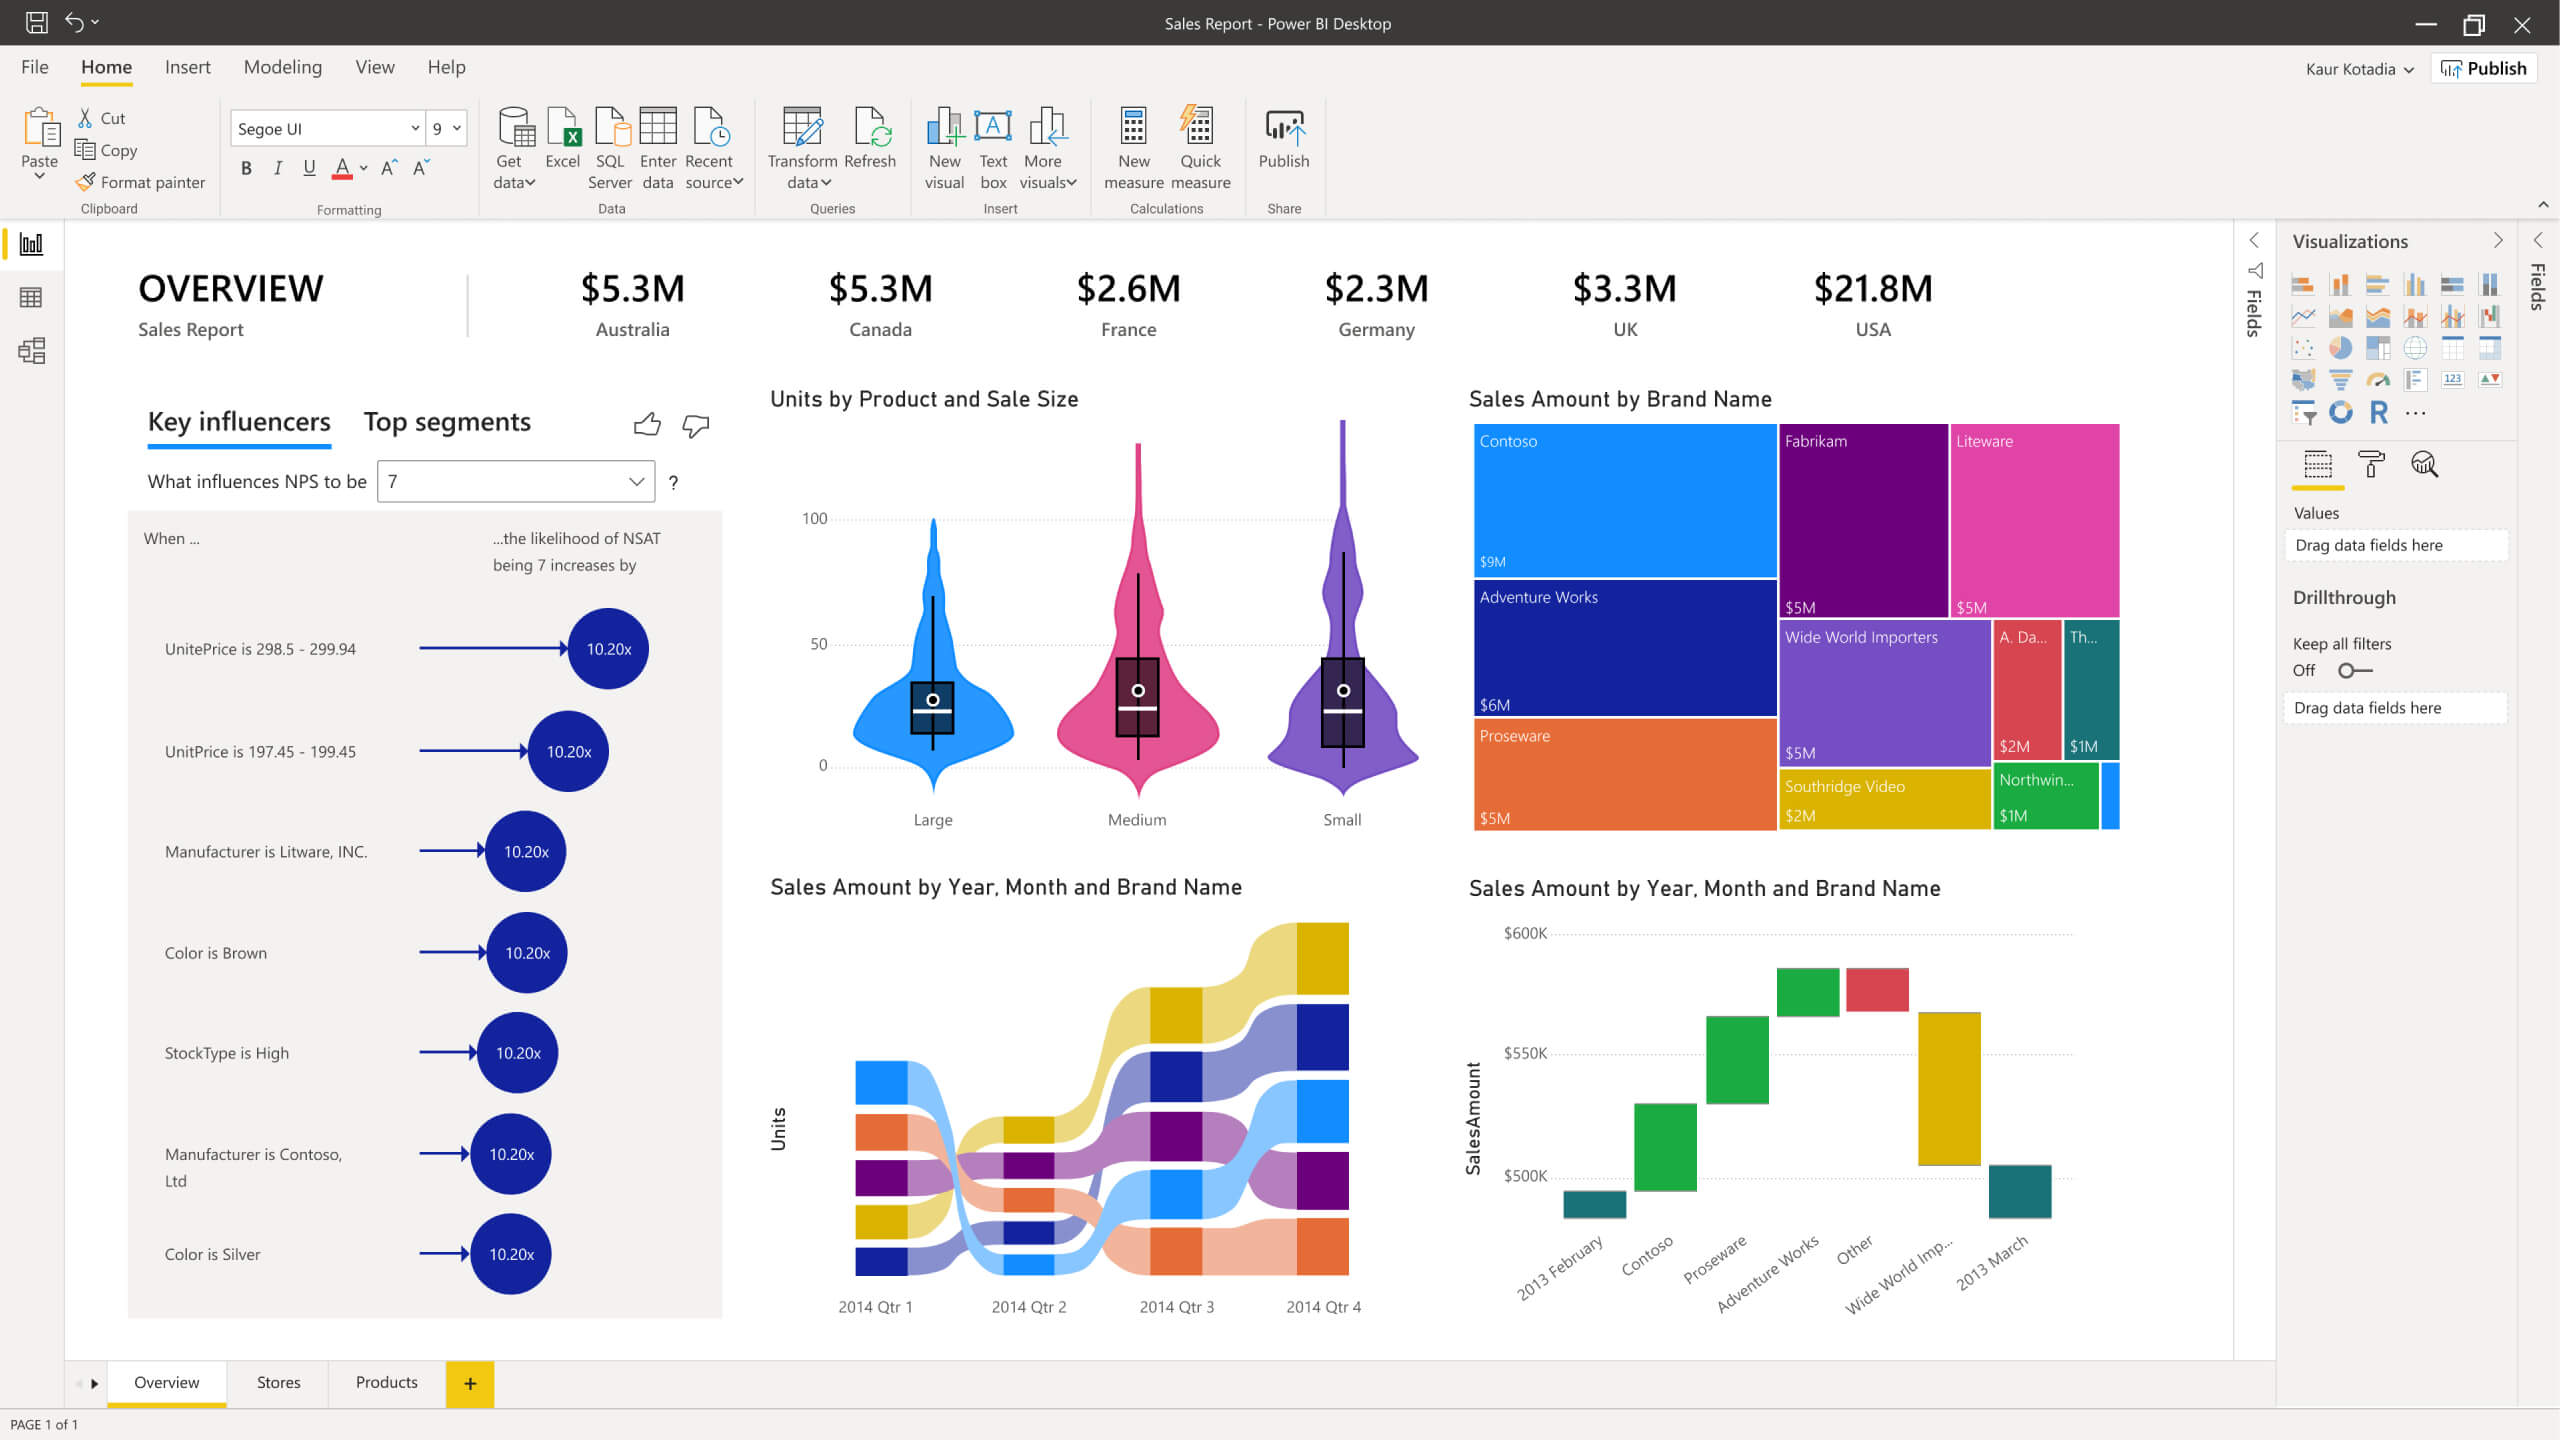
1. Dashboard
Microsoft Power BI’s dashboard uses visualization to present its functionalities. This single-paged dashboard often called a “canvass”, contains some of the essential elements of Microsoft Power BI. While the visualizations you see in it are called “tiles.”
The Canvass is an amazing way to oversee your business and view everything essential by a glance. It combines cloud and on-premises data to provide a more consolidated view of these crucial data.
Similarly, if Google Analytics enables users to share dashboards, Microsoft Power BI provides a wide array of templates that its users can download and modify. These templates are free for all users, and it allows them to create impressive and unique dashboard designs.
2. Reports
Microsoft Power BI’s reports are a combination of several dashboards with different visualizations of essential information. Each report made by Microsoft Power BI shows a complete presentation of this information and highlights the vital insights obtained from them. Then, users can share these reports with other Microsoft Power BI users.
Additionally, Microsoft Power BI has a report builder functionality. This report builder is an independent report-authoring feature that is available for Microsoft Power BI users. It is a tool that allows you to create paginated authoring, preview report in HTML format, add data from built-in providers, export reports to Microsoft Excel, PDF, And so on.
3. Visualization
Microsoft Power BI offers a range of attractive and detailed visualization to its users. With these visualization tools, you can create simple or complex customized dashboards and reports. A library of custom visualization tools is also made available for Microsoft Power BI’s users. With these tools, you can create visualizations like a map, pie charts, area charts, bar charts, graphs, etc.
Other data visualization software also provides these and more features. Explore them to improve the look of your website and attract more visitors.
4. Q&A Question Box
The Q&A Question box is a unique feature of Microsoft Power BI. With this feature, users can interact with each other, share ideas and thoughts, and answer questions to gather more information about Microsoft Power BI. Also, the software’s cognitive engines and technology allows it to provide users with the answers for their queries.
Compared to Google Analytics, this feature of Microsoft Power BI makes it stand out because it enables interaction between users. What’s more, this feature allows users to communicate in natural language.
Pricing
Both Google Analytics and Microsoft Power BI offer a free version for their users.
Google Analytics only provides a life-time free version for its users. This works best for small businesses who want to monitor and learn more about their audience.
On the other hand, the inclusions for the free version of Microsoft Power BI are one GB of data capacity, author content, data exploration, import data and reports, publishing to the web, and creating, sharing, and viewing of personal dashboards.
Another version is also available for Microsoft Power BI users. This paid plan is called the Power BI Pro, which costs $9.99 per month for each user. This version provides all Microsoft Power BI features and functionalities such as access on-premises data, collaboration with your team through Office 365, and creating and publishing organizational content.
This part of the Google Analytics vs Microsoft Power BI Comparison showed how much these two software solutions differ in their pricing scheme most especially because they both target different business sizes.
Google Analytics vs Microsoft Power BI: Which business analytics services perform best?
This ends our Google Analytics vs Microsoft Power BI Comparison. Each software was able to showcase each of its advantages and why they deserve to be two of the most-used and known business analytics software.
However, if you still can not decide which of the two should you choose, just remember the most significant difference that they have – they target different business sizes. Google Analytics will work best for small to medium businesses, while Microsoft Power BI suits large companies better.