Companies across all industries are craving for business insights that will fuel their business development and planning. Not only does it help you get a handle on your operations but also the technology help companies identify the profile of their most profitable customers. Business intelligence tools are essential to ensuring that companies remain competitive in their market and can adjust as necessary to maximize their inflow and revenue streams. A common misconception regarding business intelligence tools is that they are only for large-scale enterprises but the fact of the matter is that companies of all sizes send to gain a lot by using these technologies.
Some of the most common benefits that business intelligence software brings to the table include faster and more accurate data quality and reporting, prompt identification of market trends, competitive analysis, increased revenue, enhanced operational efficiency, and valuable business insights, to name a few.
Not all business intelligence software is created equally, some offer features another platform does not or one may be more suited to a sector more so than another system. See this guide to learn more about two particular providers, Microsoft Power BI and QlikView.
In this Microsoft Power BI vs QlikView comparison review, we will outline the main pros and cons of each platform to allow readers to see how each will stack up against each other along with critical business functionalities and requirements.
Microsoft Power BI Overview
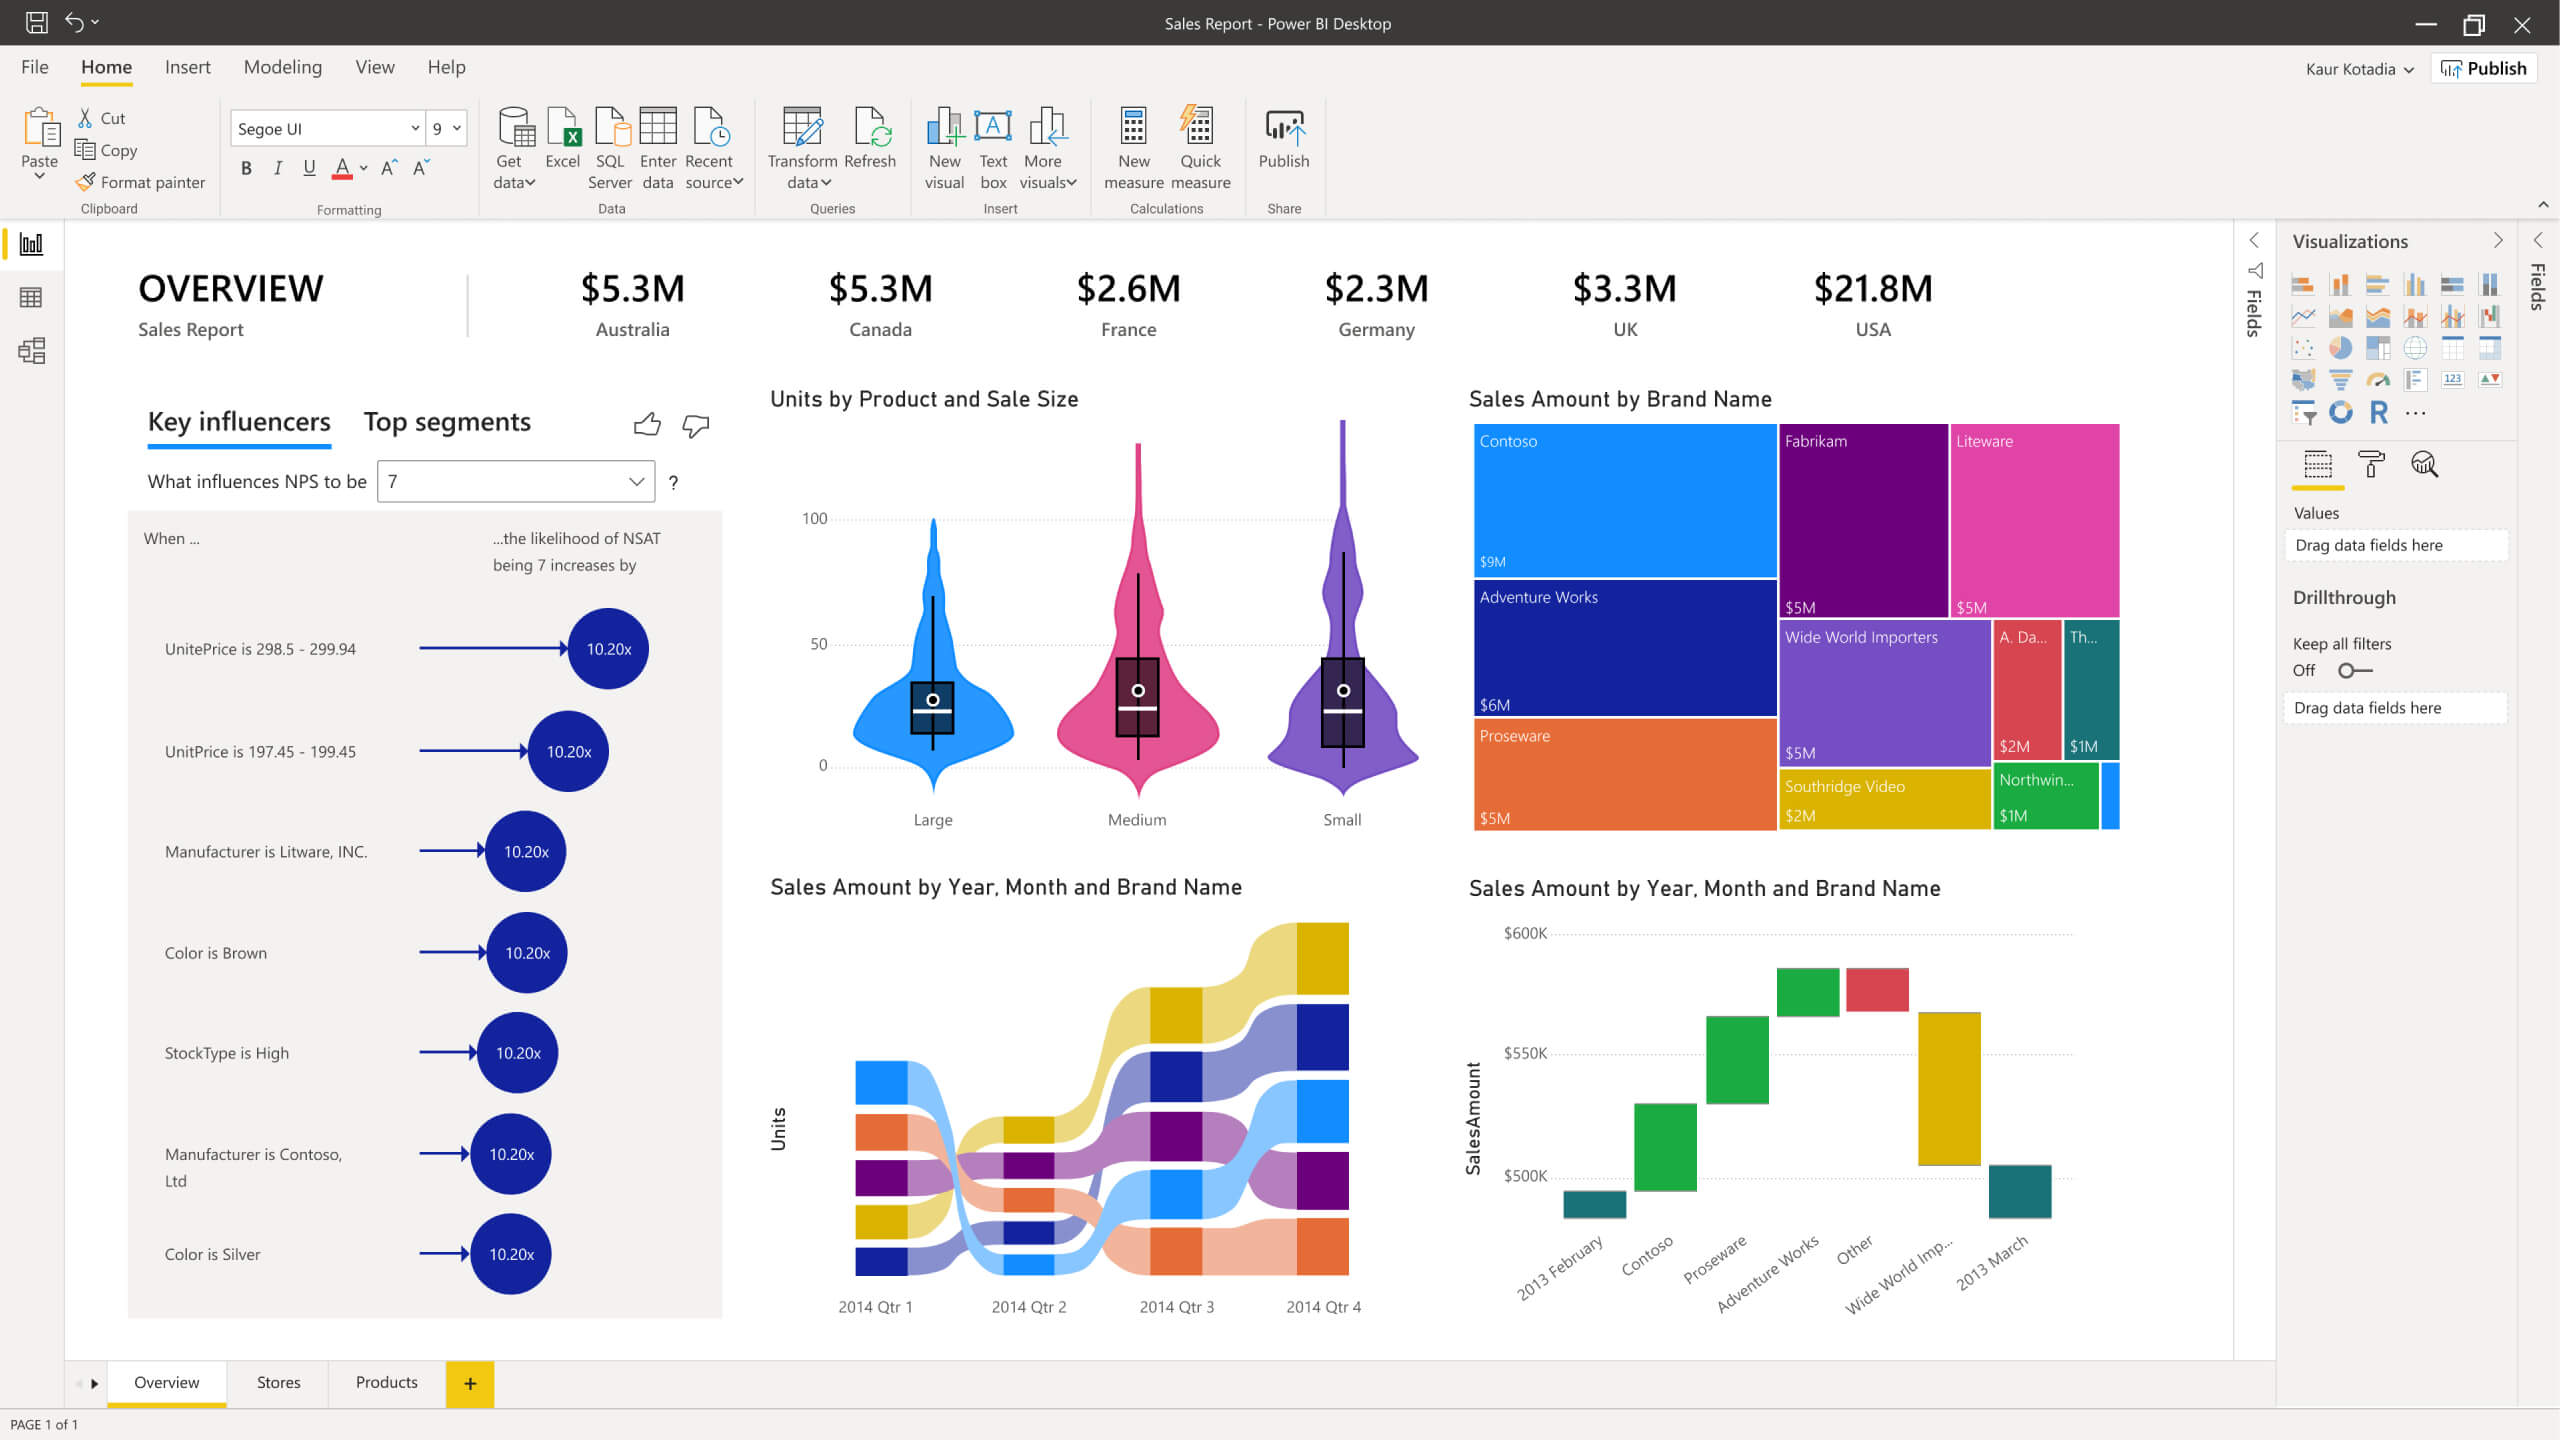
Microsoft Power BI
Microsoft Power BI is known for being one of the most user-friendly data visualizations platforms available in the market. It has a number of visual functionalities and a fairly easy layout allowing novices and those with not much business intelligence solution experience an easy time to navigate and consume the insights it has to offer. In addition to the simplicity of the Power BI’s layout, it offers a broad analytics landscape and can combine and integrate with other Microsoft offerings such as Azure, SQL Server Analysis, and more.
One more area where Power BI excels is cloud-based computing which is ideal for firms with remote employees like salespersons who are in the field but constantly need access to real-time information; through Power BI and its wide range of integrations, users can street relevant information live via their mobile devices. Power BI is ideal for those who want the ease of use that can create sophisticated and complex data analysis without the need for investments on huge data aggregation or visualization tools. Some of the core analytics features include data preparation and discovery and real-time interactive dashboards.
However, it’s important to note that since the quality of the business intelligence data is dependent on data entered, without proper data checks and audits, users would get into a situation of bad output data due to the quality of input.
QlikView Overview
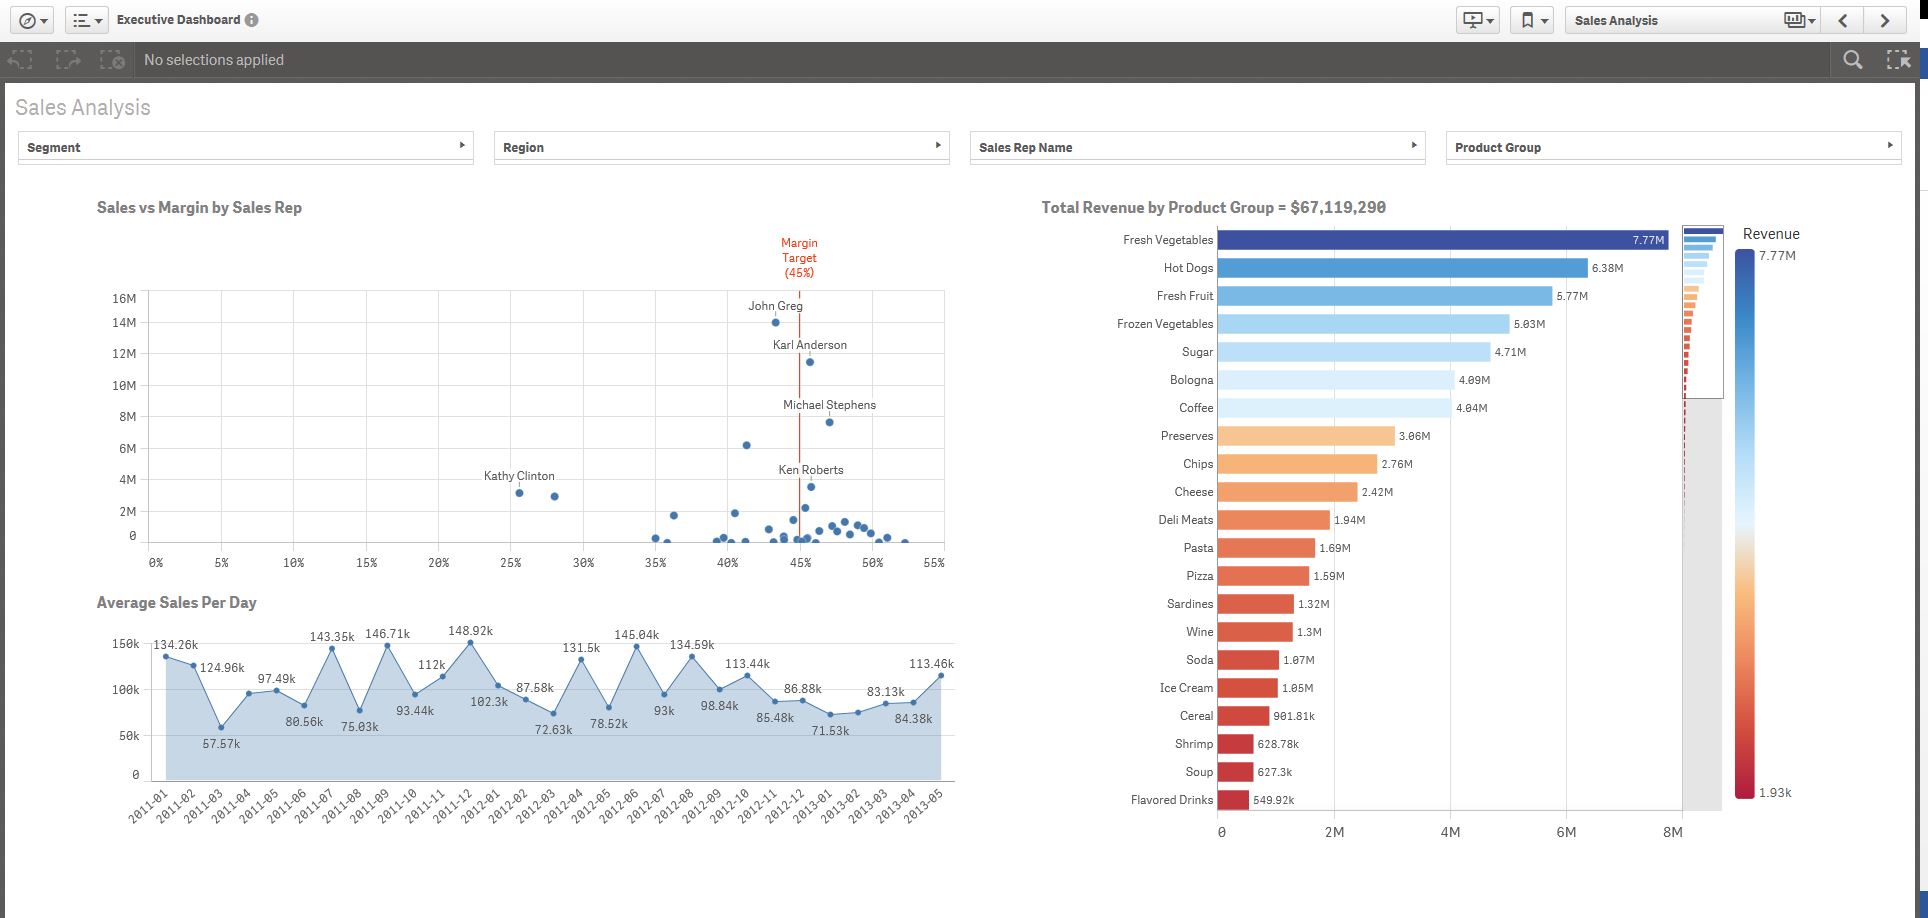
QlikView is regarded as a more robust and comprehensive solution; noting that the build and design of the platform specifically cater to analytics and more on the programming and data science professional, QlikView offers scripting features that aren’t as pronounced in Power BI. The system was developed in the 1990s and has had a considerable leg up against the competition, Microsoft BI which only began in 2013.
One of the strong areas of QlikView is its raw speed; analytics capabilities are in-memory thus, with the right amount of processing resources, users can crunch and develop insights with speed and ease. Moreover, QlikView is able to combine unlimited data sources without having to undergo any initial preparations. QlikView can essentially be plugged into any data source and pull data from various sources making it highly versatile in data management. QlikView is quite capable in document management and can convert reports into various towards including, but not limited to, XLS, PDF, and QMV.
Other advantages of QlikView include its big data holding capacity, strong power to analyze big data sets, and its mapping and drill functionalities.
On the other hand, with its advanced and complex features, a user who isn’t well versed in business intelligence tools might find the process of figuring out and using QlikView quite challenging and daunting.
Integration and Usability
In order to be an effective business intelligence solution, the platform needs to be intuitive and offers seamless integration with critical software. Given that Power BI is part of the Microsoft suite of services, it offers easy integration into popular products such as SQL Server, Dynamics NAV, and Office 365. Companies already using the Microsoft system will find this software easy to use and quite useful. For QlikView, the system also integrates well with Dynamics NAV and other source systems and also assimilates well into the Microsoft ecosystem.
Mobile and Visual Exploration
One of the key differences we need to explore in this Microsoft Power BI vs QlikView comparison is on the mobile and visual exploration as well as authoring. It is good to note that while QlikView offers advanced analytics much like Power BI, Microsoft’s platform is ahead in this area. Coupled with its smart data recovery, it’s a strong boost that provides more information across the analytics dashboard.
Pricing of Business Intelligence Solutions
Unfortunately, there are no free trials available for both these products. They are subscription-based products but setting up an account has no charge.
Microsoft Power BI Pro will cost users $9.99 per month per user and offers core functions such as building real-time dashboards, visualizations, and reports for efficient consumption of viewers. The next and most powerful tier is Power BI Premium with custom pricing. Those interested can contact the vendor for a quote-based plan.
Comparatively, QlikView’s rates are not as straight forward as Power BI. QlikView also has two editions, the first being Enterprise, and the other Personal. The pricing for the premium Enterprise edition is not readily available and those interested need to contact their sales team. According to reports, the price for this paid package starts at $1,350.
Which Business Intelligence Solution is Right for You?
Your business data is one of your most valuable resources and the ability to accurately turn these insights into strategic decisions will lead to better and more informed decision-making. Business solutions can benefit your business by boosting productivity, turning data into actionable information, getting customer behavior insights, gaining market and sales intelligence, and improving your overall visibility. If you want to know all about business intelligence software, interested readers can learn more here.
Based on the information outlined above, unless you are a very busy data scientist, Power BI would be an appropriate platform for most. Citing again its main benefits which include efficient workflow integration and advanced cloud functions, Power BI is an easy adoption if you’re already using services such as Office 365 and SQL Server. With its mobile app and seamless integration across all operating systems, users can be connected to their entire system and software quickly even when on the go.
Power BI and QlikView are two of the most well-known self-service business analytics tools and top of data visualization software available today.
More than anything, it is basically the less complicated, cost-effective, and user-friendly option. It would be good to note that this assessment is coming from a general perspective of basic to moderate use for businesses of every size. At the end of the day, if you are working in an industry that relies on upon processes heavy data analytics, there may be more variables to consider.