Choosing the best data visualization software can be tricky since there are many options to choose from. Usually, these platforms offer equally amazing features and functionalities, making it even harder for businesses and organizations to select one.
If you are experiencing this dilemma, you came to the right place. This article will compare two of the best platforms that offer the best data visualization to help you decide what is best for your organization. However, you can check out this article about data visualization software analysis if you want to explore other options. In the meantime, let’s take a look at the Plotly vs Tableau Comparison.
Overview of Plotly

Plotly is a graphic and analytics platform that helps users with no technical backgrounds to make beautiful interactive and collaborative graphs. Aside from this, Plotly enables users to use their platform as a hub for their data, charts, and code collaborations.
By using Plotly, creating graphs are made easy and straightforward. Typically, when you create a chart, you struggle to collect data, analyze them, and use codes all in different platforms. But in Plotly, you can do all these processes in one place, which makes collaboration trouble-free.
Plotly has proved itself in being a robust visualization platform that provides advanced analytics. Its features and functionalities that best suit users who want to analyze extensive data and research. It is also one of the best data visualization software that allows users to collaborate to create, edit, and share their work. This enables users to work cooperatively and come up with creative and beautiful results.
Pros:
- Provides interactive visualizations
- Allows users to use many data sources
- Built-in features for real-time updates
- Flexible software
- Unlimited customization
Cons:
- Does not support mobile devices
- Limited features provided in the free version
Overview of Tableau

Tableau is a robust business intelligence system that allows you to see and understand your business data. The essential features and functionalities of Tableau are just within a single view. This is why you can explore and analyze your data in just a matter of seconds by using this software.
Additionally, Tableau allows you to share your data between different devices – from your computer to the iPad – which gives a seamless experience. Dashboards are also available to be customized and shared with other users, even without coding abilities.
Moreover, Tableau has several products designed for different types of users. Here is an overview of four of Tableau’s products:
- Tableau Desktop – enables users to easily connect with on-premise or in the cloud data sources to explore information and help solve other user’s problems.
- Tableau Server – this product is for enterprise analytics. It helps organizations become more productive with their content management, collaboration, and data-sharing features.
- Tableau Online – this product allows users to access their Plotly account regardless of when and where they are. Tableau Online is a self-service analytics that enables users to discover and share insights by using their mobile devices.
- Tableau Prep – this product is created for the data preparation of businesses or organizations. Tableau Prep suits users who want to take data analysis to the next level.
For more robust and flexible platforms, check out this list of CMMS software.
Pros:
- Provides quality data visualization
- Allows you to connect with more than forty data sources
- Drag-and-drop functionality
- No coding skills needed
- Creating data becomes more understandable
Cons:
- Pricing plans are costly
- Automatic refreshing of reports are not available
- No version control
- The older version does not support version history
Plotly Features
1. Advanced Analytics and Reports
After analytics and business intelligence experts collect relevant data, they must communicate and deliver the data gathered to their organization’s decision-makers. Plotly allows these experts and professionals to create and present simplified and more understandable reports. Aside from this, users can create web-friendly charts, graphs, maps, and other visualizations to make their reports.
Here is a list of other data analysis software that provides advanced analytics and reporting features like Plotly.
2. Dashboard
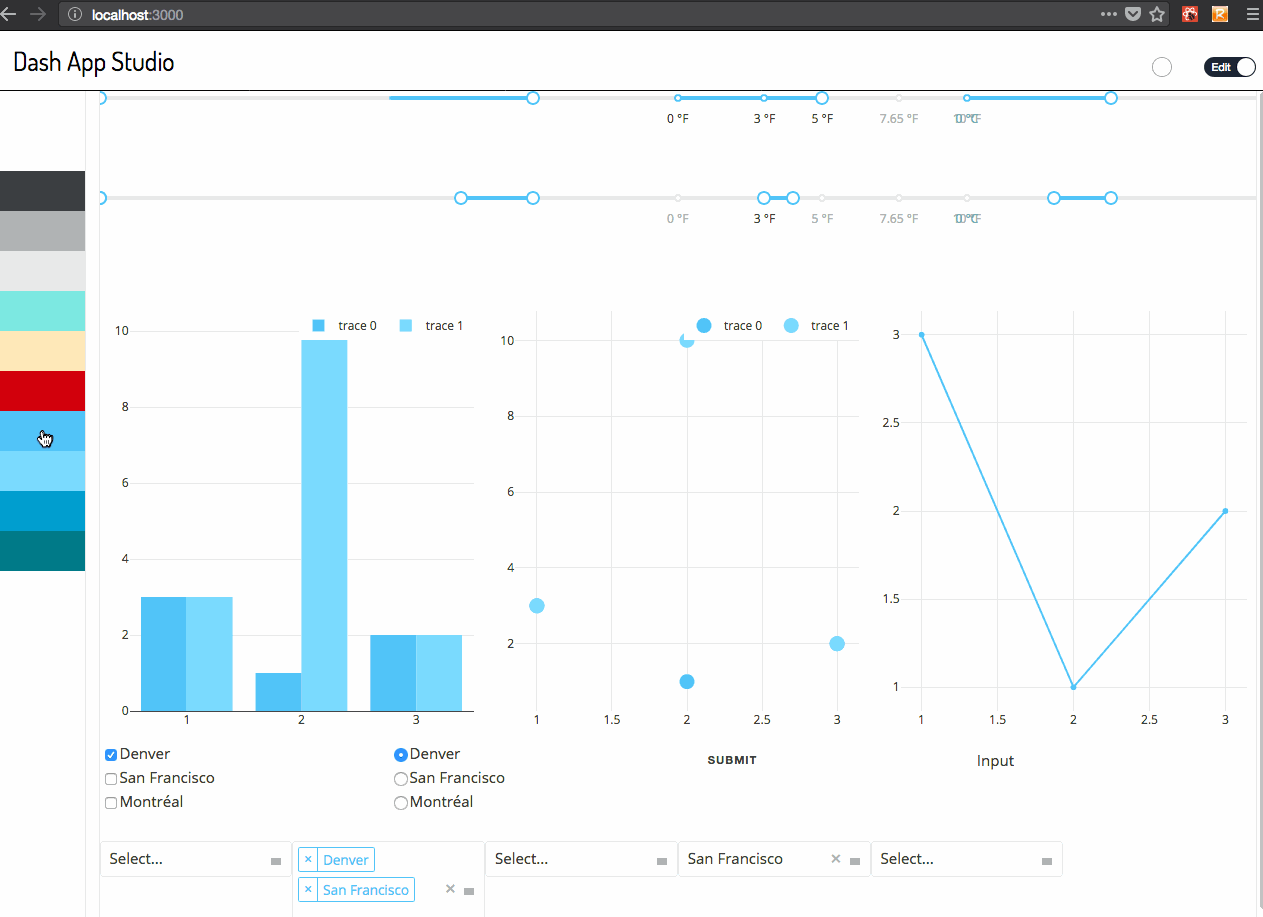
Plotly’s dashboard, also called the “Dash,” is an open-source library to help you create analytical web-based applications. Plotly created Dash to help users develop dashboards through Plotly without the need of learning codes, HTML, and using web technologies.
The Dash enables users to build apps in their language, with extensive docs and over 60 galleries with code. The Dash is also an application manager, which allows you to manage, deploy, and share your Dash apps. With this feature, users do not create visualizations. Instead, you create an interface that showcases the displays of Plotly.
3. Visualization Library
Plotly’s visualization library allows you to store your graphics and data visualizations online. At the same time, it also provides offline packages, which will enable you to create interactive changes without connecting to the internet. This library helps you create a clean interface in building your APIs.
4. Snapshot Engine
The snapshot engine allows users to save point-in-time custom views of their Dash app. It also enables you to create, archive, and share the views of your applications. Besides, it gives users the ability to generate reports in a few clicks for scheduled reporting. With this, users can share valuable information with both internal and external members of their organization.
Besides, this functionality gives end users a fast and trouble-free way to generate these reports. Each report is custom created based on the analytical Dash app’s parameters, which makes analytics and reports workflow interactive and seamless. This functionality also allows users to create automated reporting track and monitor streamed data.
Tableau Features
1. Dashboard
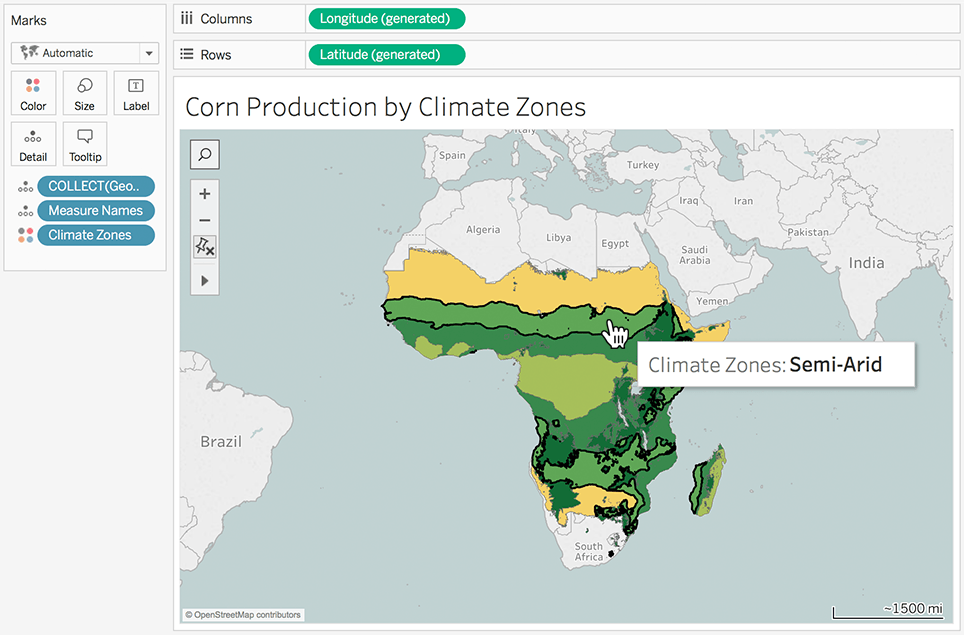
Tableau’s dashboard is a collection of views that enables you to compare several data simultaneously. It provides a summary of your essential data through visualizations.
To create a dashboard, click the “dashboard” option in the navigation panel or head on to the bottom part of your worksheet and click the “new dashboard” option. If you want to use your Tableau account on your mobile device, you can customize your dashboard’s look. Clicking the “device preview” button will show you how your dashboards will look like in other devices and customize them from this section.
Additionally, you can also set the size of your dashboard in pixels. Tableau provides preset options to customize the size of your dashboards precisely the way you want it. With Tableau’s dashboard that offers several customization features, users can surely come up with creative and unique content.
2. Drag-and-Drop Interface
Tableau’s drag-and-drop functionality is beneficial for most users because it makes their work and life more comfortable. With drag-and-drop, you can simply drag the relevant data and drop them to where you want them.
However, Tableau decided to take this functionality to the next level and provide a more outstanding service. Tableau offers a sophisticated solution in communicating and interacting with your data – and this is by using visualization. Having this advanced solution allows you to transform your data into graphs, charts, maps, tables, and anything that you want.
3. Content Library
Tableau’s workbook library started as an idea from the Tableau Community. The workbook library contributed by both internal and external users, which aims to create informative workbooks.
Moreover, the workbook library is an area where you can find tips and tricks to create better dashboards. You can also lookup answers or read articles if you are dealing with specific data issues or problems. The workbook library is a resource for learning and offers motivation and inspiration for users.
4. Visual Analytics
If you are an experienced user of this software and want to learn and discover new insights, then the Visual Analytics course can be an advantageous feature. This course is provided by Tableau for users who wish to enhance their design and visualizations, but it does not include an introduction to Tableau’s products.
If you wish to take this course from Tableau, they will provide a student manual and workbooks. The student manual contains topics covered during the entire course and some hands-on activities to enhance your visualization skills.
With the Visual Analytics course, Tableau aims to develop your analytic skills and master different visualization practices. This is advantageous for users looking for excellent data visualization software because this platform can also be a way to enhance their expertise and ability.
Pricing
To complete this Plotly vs Tableau Comparison, each software’s pricing and licenses will also be discussed. This way, you can identify which software meets your needs and as well as your budget.
Plotly offers several pricing options for its users. The Community Edition is the free plan that they offer. Their following subscriptions are paid annually. The student plan costs $99, Personal plan costs $420, and the Professional plan costs $840. Plotly’s in the pricing plans for cloud-based software costs $9960 for Chart Studio Enterprise and $15960 for Chart Studio Enterprise + Dash Deployment Server. At the same time, on-premise software costs $14940 for Chart Studio Enterprise and $24960 for Chart Studio Enterprise + Dash Deployment Server.
In comparison, Tableau offers one free plan and three paid plans, which are also billed annually. The Tableau Creator plan is available at $70 and includes access to three of Tableau’s products – namely Tableau Desktop, Tableau Prep, and a creator license for Tableau Server. The next pricing plan is the Tableau Explorer for $35 per user. A minimum of five users is required to subscribe to this plan. Also, the Tableau Explorer plan gives you an explorer license for Tableau Server. Lastly, the Tableau Viewer is available for $12, which requires at least one hundred viewers.
Plotly vs Tableau: Which data visualization software should you try?
This is the end of the Plotly vs Tableau comparison. Both software proved themselves to be flexible and helpful enough to accommodate the different needs of their users. If you are looking for a data visualization software that your organization should try, consider these two software solutions and put them on top of your list.
