Datapine Review
 OUR SCORE 88%
- What is Datapine
- Product Quality Score
- Main Features
- List of Benefits
- Technical Specifications
- Available Integrations
- Customer Support
- Pricing Plans
- Other Popular Software Reviews
What is Datapine?
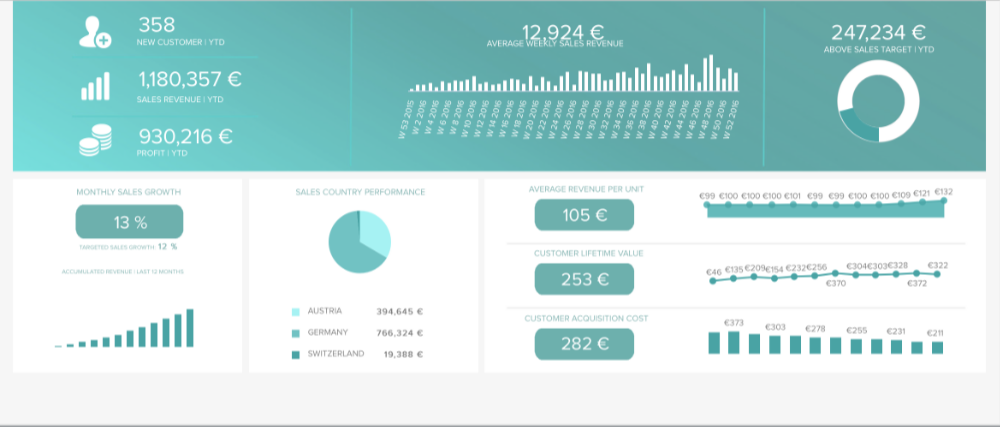
Datapine is a dynamic dashboard that specializes in three main areas: interactivity, customizability, and shareability. It is ideal for companies of all sizes that need a way of managing plenty of data. Businesses have so much data to capture that it is difficult to handle them only through documents, spreadsheets, or slides. The more data you have to store, the more confusing they will be, especially when they are in many different places. The benefit of Datapine is that all your data is centralized in one visual dashboard. The dashboards also vary by industry. This is beneficial because you can show your data in a way that truly reflects the information that you need to see. You are also given the ability to customize your dashboard. You can transform graphs and charts, change the color and style, as well as custom which set of data appears. The software also supports exporting and publishing your dashboards so that you can share it to different teams or departments.Product Quality Score
Datapine features
Main features of Datapine are:
- Dashboards by Industry
- Interactive Dashboards
- Customizable Dashboards
- Shareable Dashboards
- Data Visualizations
- Performance Metrics
- Predictive Analytics
- Drag and Drop UI interface
Datapine Benefits

The main benefits of Datapine are customizability, interactivity, and shareability. Here are more details on Datapine’s benefits:
Customizable
Datapine has predefined themes that you can use to quickly create aesthetically-pleasing dashboards. It also has global style options that you can implement in your dashboard. If you don’t want to use the preexisting themes and styles or if your company has certain rules for branding, you can customize both the style and color. You can even save the hex color codes that you often use to make the colors easily accessible for future use. Additionally, you can change the structure of graphs and charts. The software also allows you to change the location of your graphs and charts using its drag-and-drop user interface. You can also filter the data you want to be shown. If you have no need for a specific set of information to be shown, then you can easily delete it from the dashboard.
Interactivity
Datapine has a filtering tool that allows you to filter results. For example, you may only need to see results from a branch in France rather than all your branches. The software also has a zoom capability that you can use to focus on specific elements or even individual figures whenever you want. Dashboard interactivity gives you an efficient way of monitoring and analyzing your performance metrics and business statistics. Read here for additional information on business intelligence software tools, especially on key features and capabilities.
Shareable
After you are done customizing the dashboard, you can share it with colleagues or to a different department. This promotes collaboration between the different members of your company. Datapine also has a public URL sharing option in which you can share the dashboard as a link so that viewers can access it on a browser. You can also use the URL sharing tool to copy the link and embed it into your sites or emails. The recipient is even able to use filters to refine the dashboard.
Technical Specifications
Devices Supported
- Web-based
- iOS
- Android
- Desktop
Customer types
- Small business
- Medium business
- Enterprise
Support Types
- Phone
- Online
Datapine Integrations
The following Datapine integrations are currently offered by the vendor:
- Amazon Web Services
- Microsoft SQL Azure
- Microsoft SQL Server
- MySQL
- PostgreSQL
- Oracle
- Salesforce
- SAP
- Dropbox
- MariaDB
- Heroku
- Microsoft Excel
- Google Sheets
Video
Customer Support
Pricing Plans
Datapine pricing is available in the following plans:


