In today’s world, data is king. Governments use it to diagnose inefficiencies while organizations use data to predict the future that they want to shape. Even sports teams like the Oakland Athletics and the Philadelphia 76ers famously use data analysis to improve performance. Now, more and more businesses employ data analysis products by leveraging technologies, such as business intelligence and analytics software solutions.
Thus, many software providers are popping up all over the place. They offer business intelligence tools, big data analytics software, best virtual data rooms review and even modules for data analysis in other business systems. These include reporting tools and visualizations. All of these can be helpful if we know how to use them. We get to analyze historical information and present conditions to take a glimpse of the future.
However, not all data analysis tools are the same. Some specialize in certain features and industries, albeit many are quite flexible as to where you can deploy them. In this article, we’ll discuss what data analysis software is, its types, features, and benefits. Also, we’ll take a look a quick look at the trends of where data analysis is going.
What is Data Analysis Software?
Data analysis software solutions are tools that allow users to gather, process, and gain insights from complex swaths of data from seemingly disparate sources. They also provide visualization tools to make organized data easier to digest. Additionally, the best data analysis software solutions out there give you insights on their own. This is thanks to their powerful built-in AI engines.
Analysts use a myriad of data analysis tools to find patterns and anomalies. Utilizing data analytics services can offer a deeper understanding of key performance indicators, enhancing decision-making processes. Many entrepreneurs believe that it is in data that we can weave useful stories for our business. This is especially true for the stories we make to guide future decisions. Thus, it is not just the software that’s valued but also the people tasked to learn and use it.
So, data analysis software is built for data analysts to perform their work well. They are also there to help them work conveniently. But, as mentioned, not all data analysis platforms are created equal or with the same features. So now, let’s take a quick look into the different types of platforms on the market.
List of Best Data Analysis Software
As mentioned, you can turn a simple spreadsheet into a data analysis tool. However, this is not the best way to go. Markets reward efficiency and speed. Thus, you don’t want to reinvent the wheel. The best approach to do analysis is through standalone software or via modules in a software suite. In this section, we present to you five top data analysis software in the market today.
- KISSmetrics: This is a business intelligence software that helps businesses keep watch of key metrics in their operations. With this, users can gain insights on whether the metrics they use are good or not and eventually improve how they measure performance. Core features of this platform include testing sandboxes, A/B testing, cohorts reporting, customer profiling, real-time data monitoring, segmentation, and retention reporting. These will help you understand how your business fits in the market and how you can change internal measures for future actions to be successful. It also integrates with other business systems, such as MailChimp, Shopify, and Marketo, among others. Pricing starts at $500 per month.
- Cluvio: Cluvio is a popular business intelligence software that uses SQL and R to extract, gather, and analyze complex data stored in their systems. Users enjoy how it allows them to gain extra insights from usually untouched data. It also has an intuitive interface for a very comprehensive tool. Its key tools include an SQL editor, SQL snippet, Analytics to the Power of R, shareable interactive dashboards, and a database almanac. With these, you can not only analyze data for actionable insights but also share and collaborate with others easily. Moreover, it integrates seamlessly with other business applications, such as MariaDB, Oracle, Aurora, and AWS, among many others. Pricing starts at $107 per month.
- Sisense: This is one of the top business intelligence and analytics tools in the market. It packs comprehensive features for data gathering and processing. Moreover, the system features beautiful visualizations and dashboards that let you monitor real-time data. Among its core functionalities are top-notch data handling, scalable analytics, a centralized data hub, visualizations, widgets library, metrics identification, data connectors, and ad-hoc analysis. In addition, Sisense integrates well with other business systems so analyzing data from different aspects of your operations is easy. Lastly, it is highly flexible for your needs as it is only available in custom quote-based plans.
- Looker: Primarily a data discovery application, this tool is used by businesses to gain actionable insights through data analytics. What’s nice about this app is that you can create your analytics modules. This way, you can customize how you do analyses that fit your business. It also comes with a slew of other features, including an easy-to-use web-based interface, customizable dashboards, collaboration tools, live connection to any SQL database, real-time data exploration, and exportable visual reports. In addition, it provides dashboards that can work on any device, making it ideal for teams that are always on the go. Moreover, because of its open API architecture, you can integrate this platform seamlessly with other digital business tools. Lastly, it is offered via personalized quotes.
- Sisense for Data Teams: Formerly known as Periscope Data, this advanced analytics platform fits functionality, flexibility, and usability. Users enjoy how the software allows them to gather data, create models, and test them directly in the system. Thus, this is a good platform for predictive and prescriptive analytics. Core features include modules for data mining, data discovery, data cleansing, and data visualization. It is also packed with many capabilities, thanks to features like its Python editor and SQL alerts. It also has an embed API for flexible analytics. Moreover, the platform can integrate with many business systems, including PayPal, NetSuite, and Salesforce, among many. Like other platforms from Sisense, this product can be purchased via quote-based subscriptions.
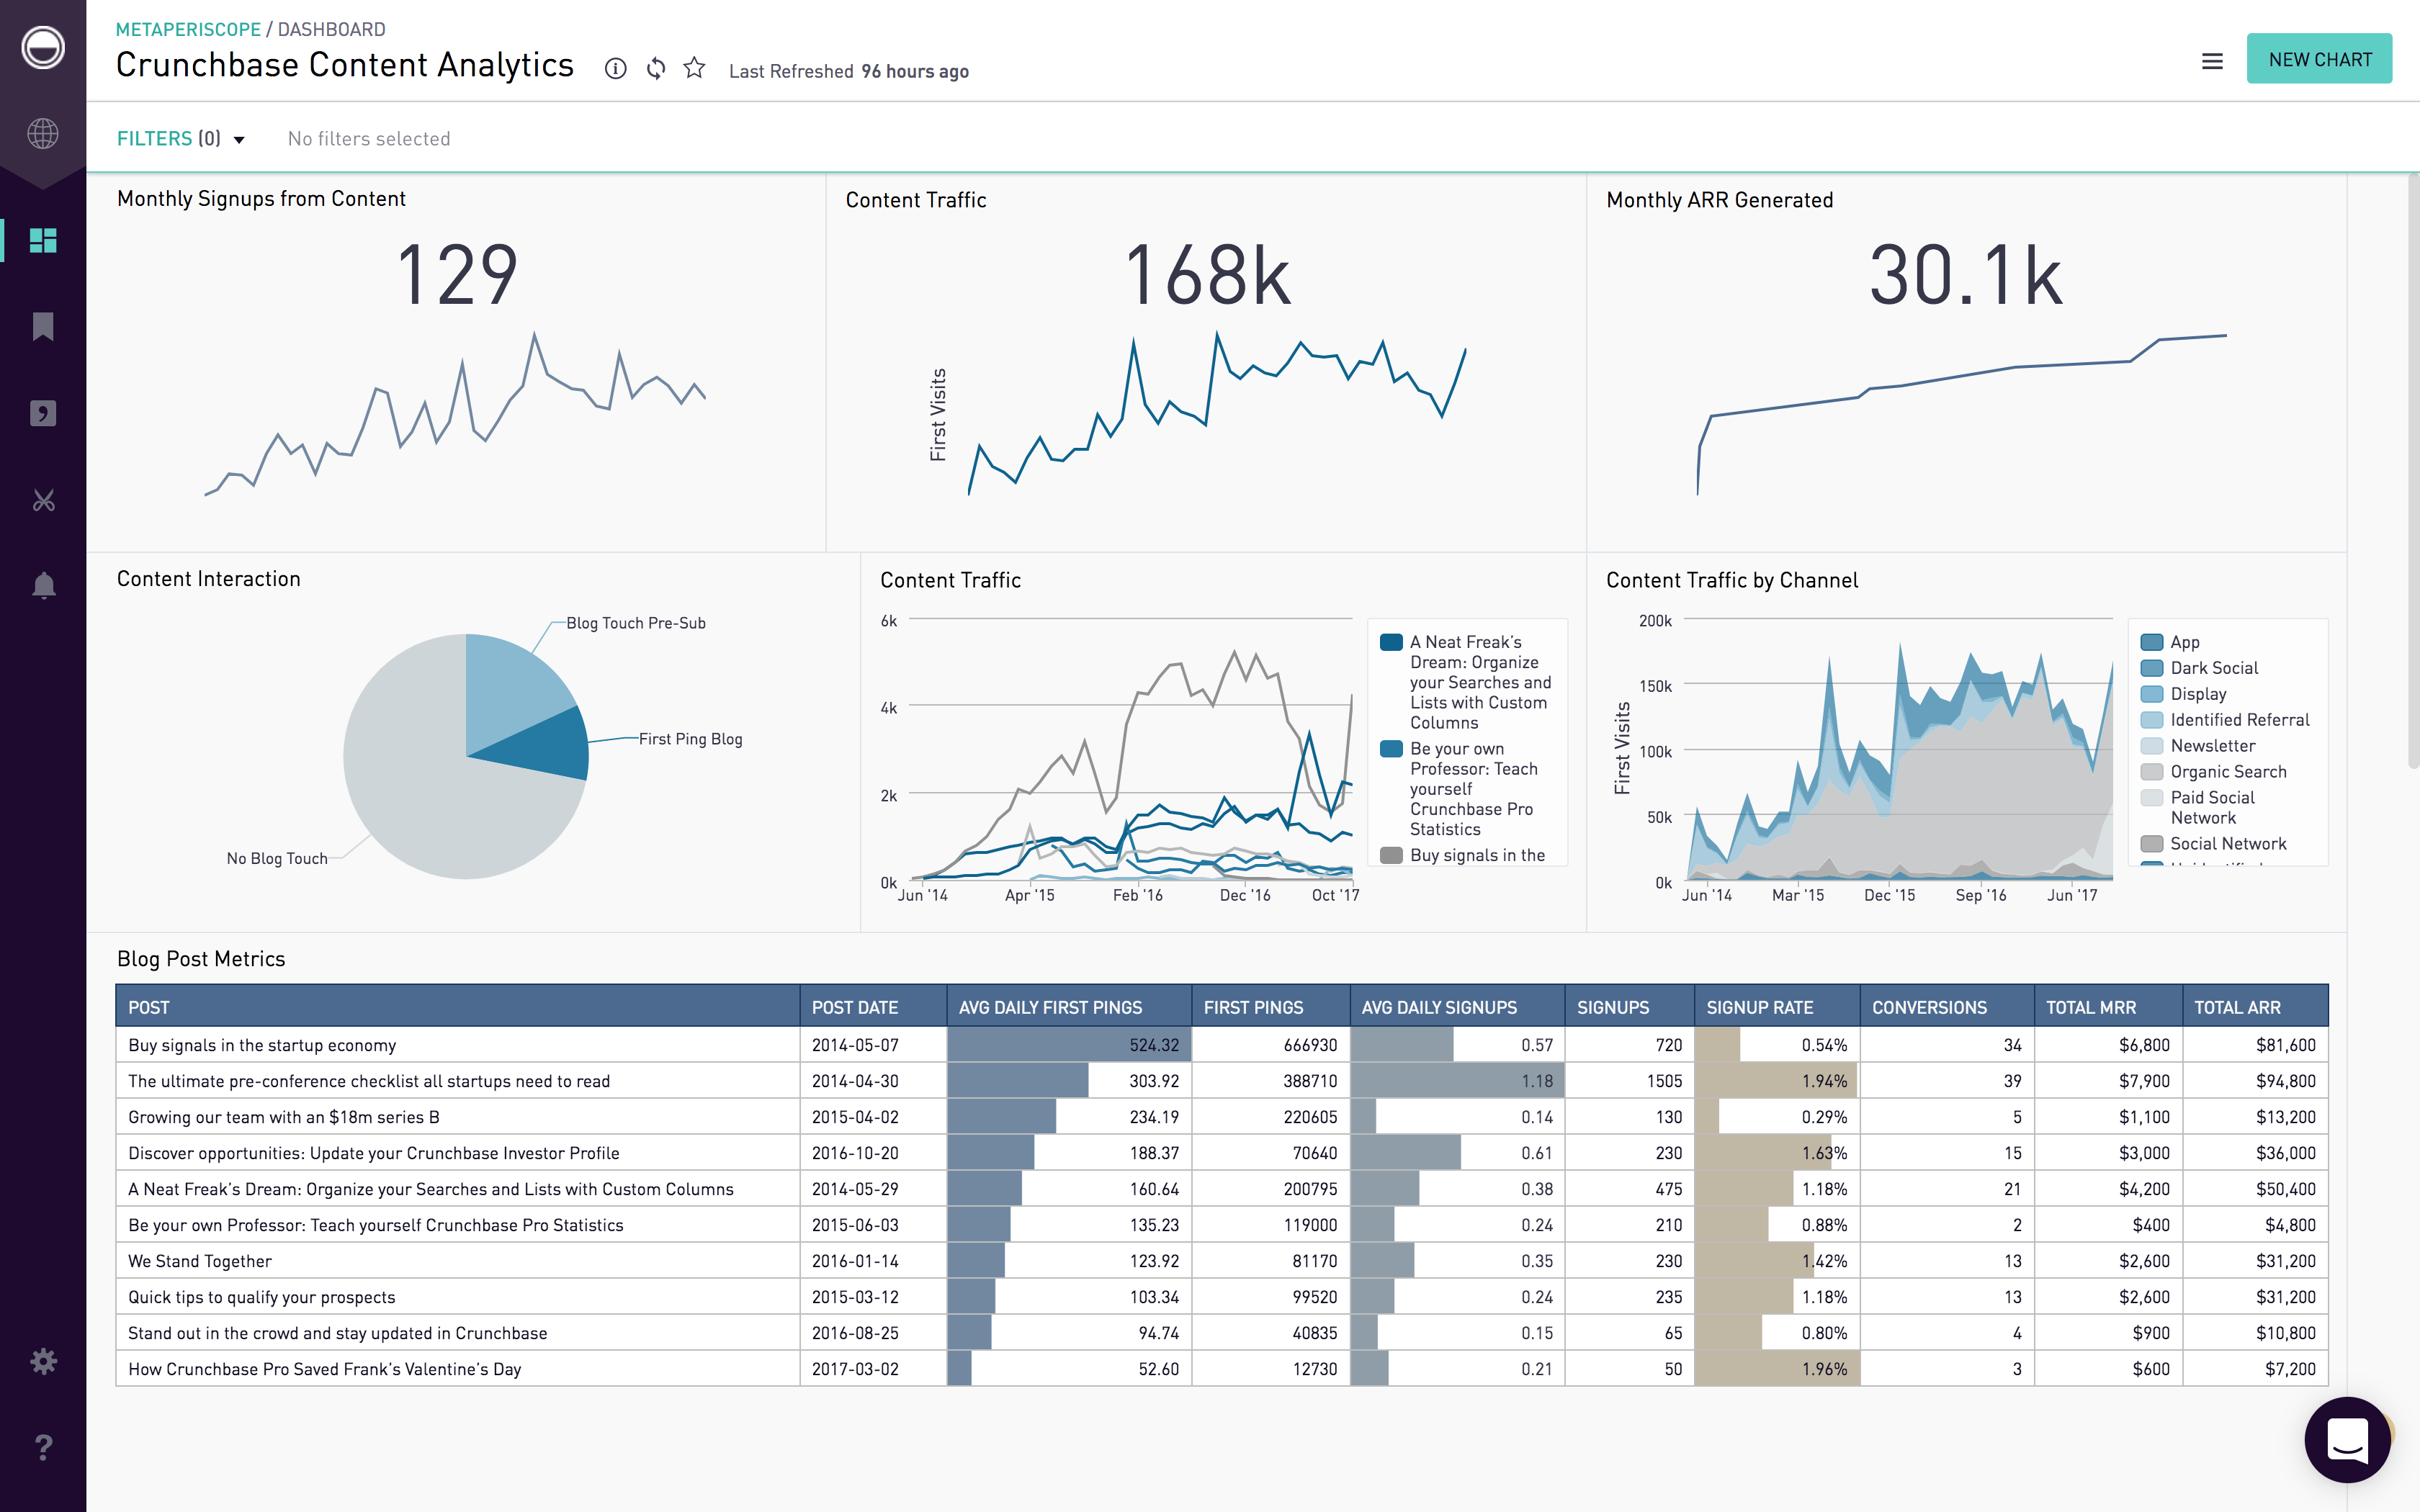
Periscope Data is one of the most popular data analysis software on the market.
- JMP: A data analysis software designed for both Mac and Windows users, this is a go-to app for data explorers, ranging from scientists to engineers. It is engineered to help users to access data from disparate sources quickly. Moreover, it provides quick and reliable data preparation tools. Data exploration is only the tip of the iceberg when it comes to JMP as this powerful platform also allows you to make discoveries, thanks to modules for analyses and graphics. With these tools, you can derive new insights, discover relationships, and develop a deeper understanding of your subject matter. Its core capabilities include interactive visualizations, shareable visualizations, data acquisition, data clean up, reliability analysis, what-if analysis, analytics hub, and statistical modeling, among others. Moreover, it has a JMP Public feature where you can browse useful visualizations shared by other JMP users. Lastly, pricing starts at $125 for individual users. The vendor also offers a corporate license by quote.
- RapidMiner: A software service built to contain the depth that data scientists require while simplifying it for everyone else. This end-to-end data science platform allows you to easily prep your data and to create models. Its machine learning module allows you to design models via an easy-to-use visual workflow designer. Thus, you can easily deploy and manage these models to turn them into prescriptive actions. The program is being used in a wide variety of industries from healthcare to ecommerce. Users enjoy how it helps them cut costs, drive revenues, and avoid risks. There are many types of RapidMiner products as well. They range from automated modeling to on-demand cloud-based AI. Its most popular product is RapidMiner Studio. It is a workflow designer intended for your entire analytics team. Its annual plans start from $5000 per user. Also, there is a free trial that you can take advantage of.
- SPSS: Another popular tool used by corporations and social scientists alike, this is a go-to app for solving complex research and business problems easily. Armed with an easy-to-use interface, this platform is easy to use, especially if you already have a good grasp of statistical tools. For advanced users, they can even use extensions and integrate it with open-source tools using R and Python codes. Among its key features are data security protocols, advanced descriptive statistics, regression analysis module, and task automations. There are other important features, including decision trees, forecasting, direct marketing, and even neural networks. Pricing starts at $99 per authorized user per month. However, you can enjoy full SPSS features for a limited amount of time, thanks to its free trial offering.
- Scilab: An open-source software specializing in numerical computation. It is used in research, education, aerospace engineering, and the automotive industries, among others. The software includes modules for numerical analysis, data visualizations, scientific programming, and algorithm and application development. What’s great about this free product is that it also has a cloud deployment available so you can simply access it via your web browser. Moreover, the cloud version has key features such as user management, application management, and data visualizations as well. In fact, you can virtually do everything you can do on the desktop version on the cloud as well.
- GoodData: The platform allows you to easily embed analytics in your product or service without IT or other expert help. Thus, you can empower your franchises and subsidiaries with enhanced visibility and decision power. GoodData even allows you to build your own deployment or choose their full-service package. It doesn’t matter which you choose though. You can have your first version up and running in just a few weeks. Then, you will be able to get real-time data and insights. Moreover, you can choose to try the product via its free plan. This includes five workspaces with 100 MB/workspace. Paid plans start at $20 per workspace per month billed annually for an unlimited number of users. These plans include unlimited dashboards as well. Also, you can have dashboards for desktop, tablets, and mobile devices too.
Types of Data Analysis Tools
There are many types of data analysis software. They range from spreadsheets to hardware-intensive solutions. If you want to categorize them all, you’d include weather analysis software, flight path analysis software, and the like. However, we are only interested in the ones that you can use in businesses and similar organizations. Thus, we’ll only cover these types. Also, we’ll make it as general as we can here as there are a lot if we are to nitpick each.
Text Analysis
These tools allow your business to analyze texts from documents to social media accounts. They provide context, insights, and even interpret the sentiments of people. You usually encounter this type of data analysis with social media listening products. However, there are standalone tools for general use.
Descriptive and Inferential Analysis
Descriptive analysis processes seek to describe and quantify the data that you already have. Programs with this module allow you to find outliers and variance among many things. In a nutshell, it summarizes your data meaningfully. Inferential analysis, on the other hand, uses your sample information gathered to make useful generalizations with a degree of reliability. Most of the time, both sets of tools come with the same program. In fact, if you are good at Excel, you can make them from scratch.
Diagnostic Analysis
These tools and processes allow you to diagnose what’s happening in your daily operations. This is best for making historical analysis of your performance. When done correctly and with a good tool, it can help you see possible policies and actions to do in the future to optimize your processes. This type of tool focuses largely on the causes and effects.
Predictive and Prescriptive Analysis
Business is all about prediction. The outlook is always future-centric. Thus, business people continue to find ways to hone their predictive engines and scaffold them with tools so that they can outsource computing processes. This is where predictive analysis comes in. It shows what things are likely to happen. On the other hand, prescriptive analysis, as its name suggests, prescribes what decisions or actions to take given the situation and the likely scenarios to happen.
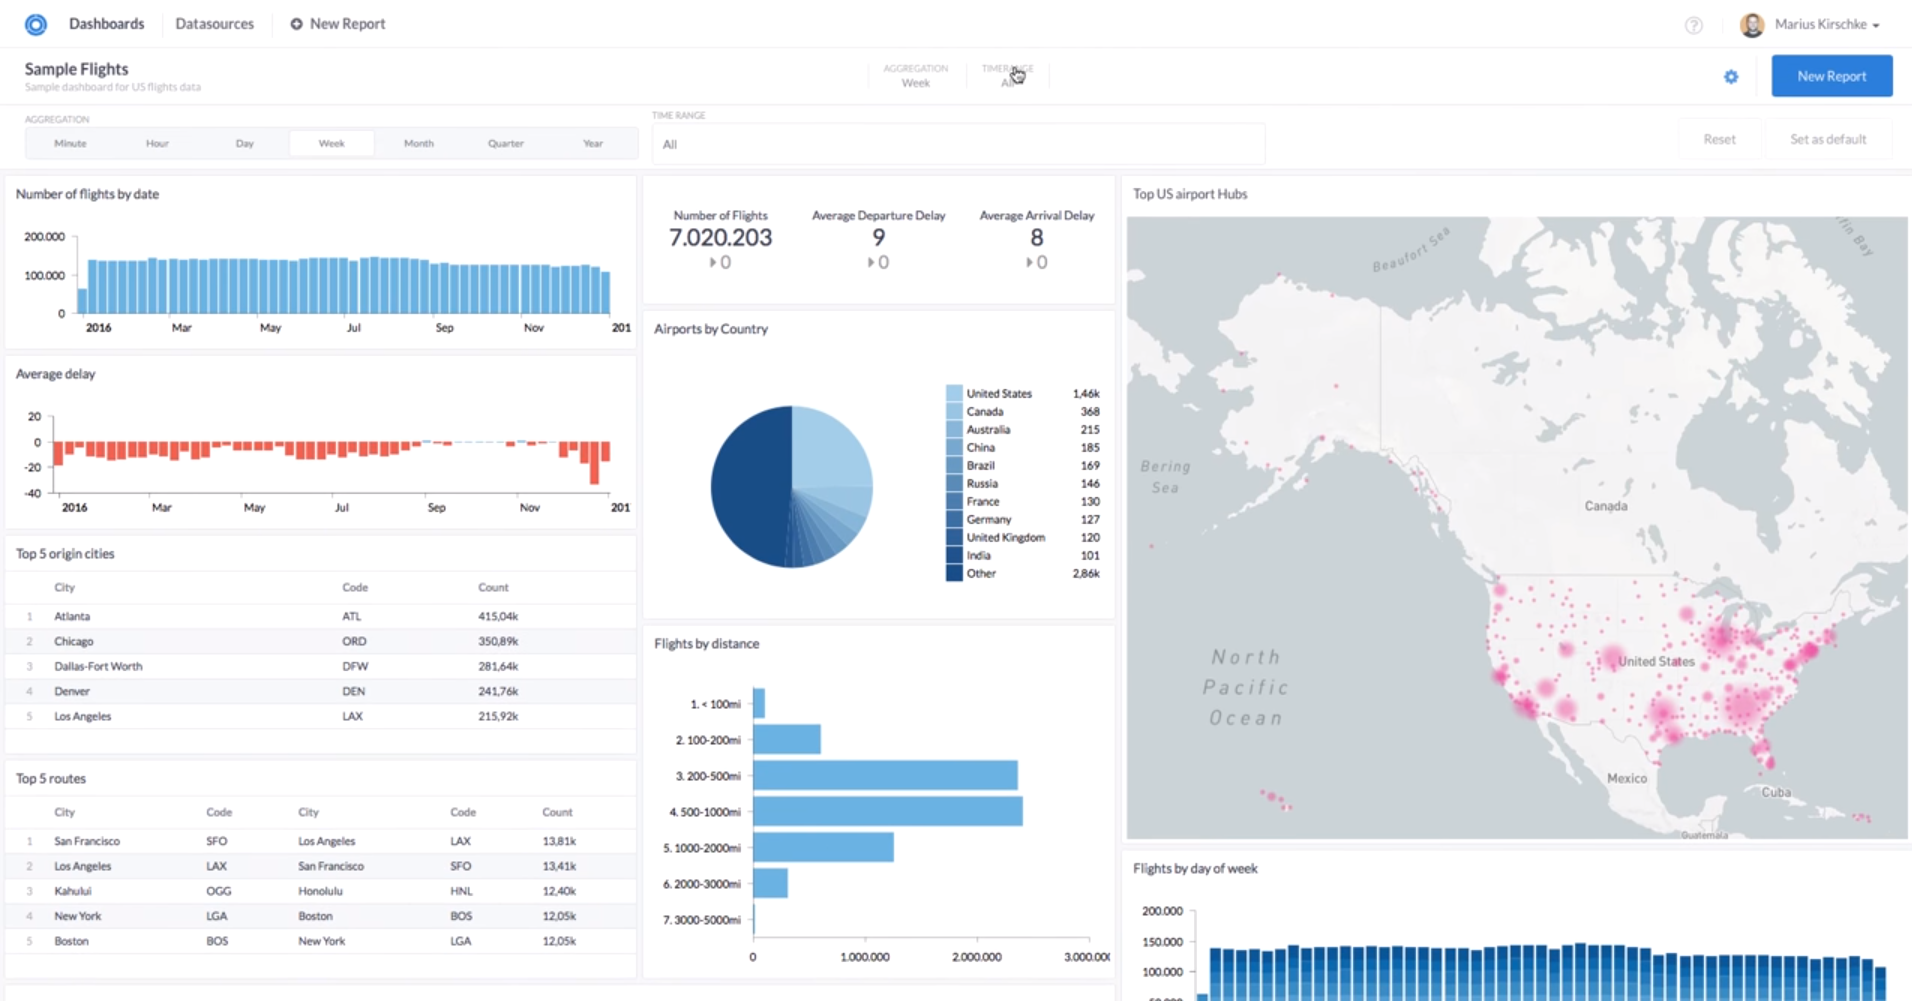
Cluvio is a data analysis software equipped with tools that will help you perform predictive analysis and more.
Key Features of Data Analysis Software
Even though there may be different types and examples of software used for data analysis, they generally have standard features. Also, even though standalone spreadsheets solutions can be considered as tools for data analysis, they don’t have the tools to be called a good software product for data analysis by today’s market standard. So, in this section, we’ll list and briefly discuss the key features that make a standalone data analysis software good.
- Data connectors
- Customizable dashboards
- Clear visualizations
- Custom reports
- Workflow automation
- Customizable rules and formulas
- Database
- Integrations
- Collaboration tools
- Shareable dashboards and reports
All these core features allow you to gather and process data to generate actionable insights. Also, they allow you to collaborate and share your insights with other people.

Sisense is a leader in data analysis because of its extensive features that let you perform everything from data collection to visualization.
Benefits of Data Analysis Software Adoption
There are many specific benefits that you can get from adopting data analysis techniques made available by software. These depend on your specific use and goals. However, many believe that there are general benefits. Here they are.
- Get a bird’s eye view of business health.
- Maintain a clean database for important metrics.
- Easily create and share reports.
- Collaborate with other analysts and departments.
- Monitor KPIs in real-time.
- Be able to take a look at data from different angles
- Create future projections and policies based on past and present data.
Overall, the main benefit of software-enabled data analysis is that you can foster a culture in your organization that reflects in a data-driven way. Also, this allows you to correct your course and optimize your processes. You can conduct more complex analyses as well that can inform your business decisions. This includes sensitivity analysis and model testing. These are pretty difficult to do properly without software tools.
Factors to Consider When Purchasing Data Analysis Software
Buying software is a commitment. And, you don’t want to get stuck using the wrong or inferior software. So, before you commit to one, you should know that there are important factors that you should consider before subscribing to a software solution. Here they are:
Ease of Use
Firstly, you want a solution that is intuitive to use. Data analysis is often hard and complicated, especially when dealing with disparate and complex data. Thus, you don’t want a solution that makes this harder than it already is. So, when looking at software, be sure to try out its controls first. You can do it by signing up for free trials and demos.
Comprehensive Feature Set
Secondly, you want a solution with all the tools that you’d need. Go for a product that has more features than you can use. This is because as you and your team get better in data analysis, you will find additional use for the once “extra” tools. Of course, if you have a simpler operation, you can opt for less comprehensive products or packages. However, just make sure you can scale them to your needs anytime.
Integrations and File Support
Thirdly, you’d want a solution that can work with other digital tools. This is important for data gathering. You don’t want to spend extra time prepping your data, like converting them into files. Let the software do the work for you. So, when you are looking at products, be sure to see if the files it supports match with the file types you use. Also, be sure that it can work seamlessly with other business tools that you have like your CRM and accounting software.
Collaboration and Mobile Access
Fourth, you want a solution that users can easily access via mobile. This is because it will be easier to collaborate with other people in the field and on the go. Collaboration shouldn’t stop whenever you step out of the office. Also, when choosing software, be sure that there are ample collaboration features for desktop or web as well. Check if your solution has shareable reports. The more interactive, the better.
Pricing and Payment Options
Lastly, be sure to check the pricing if it fits your budget. You don’t want to get stuck with something so pricey that you accrue losses instead of gains. Yes, data analysis could be profitable. However, many of the top solutions seem a bit pricey for smaller businesses. So, you need to consider the price.
Furthermore, you should also check out the pricing options available. Many times, software providers give discounts for annual plans, even going by as much as 30%. So, if you can avail of this, you’d save a lot of money.
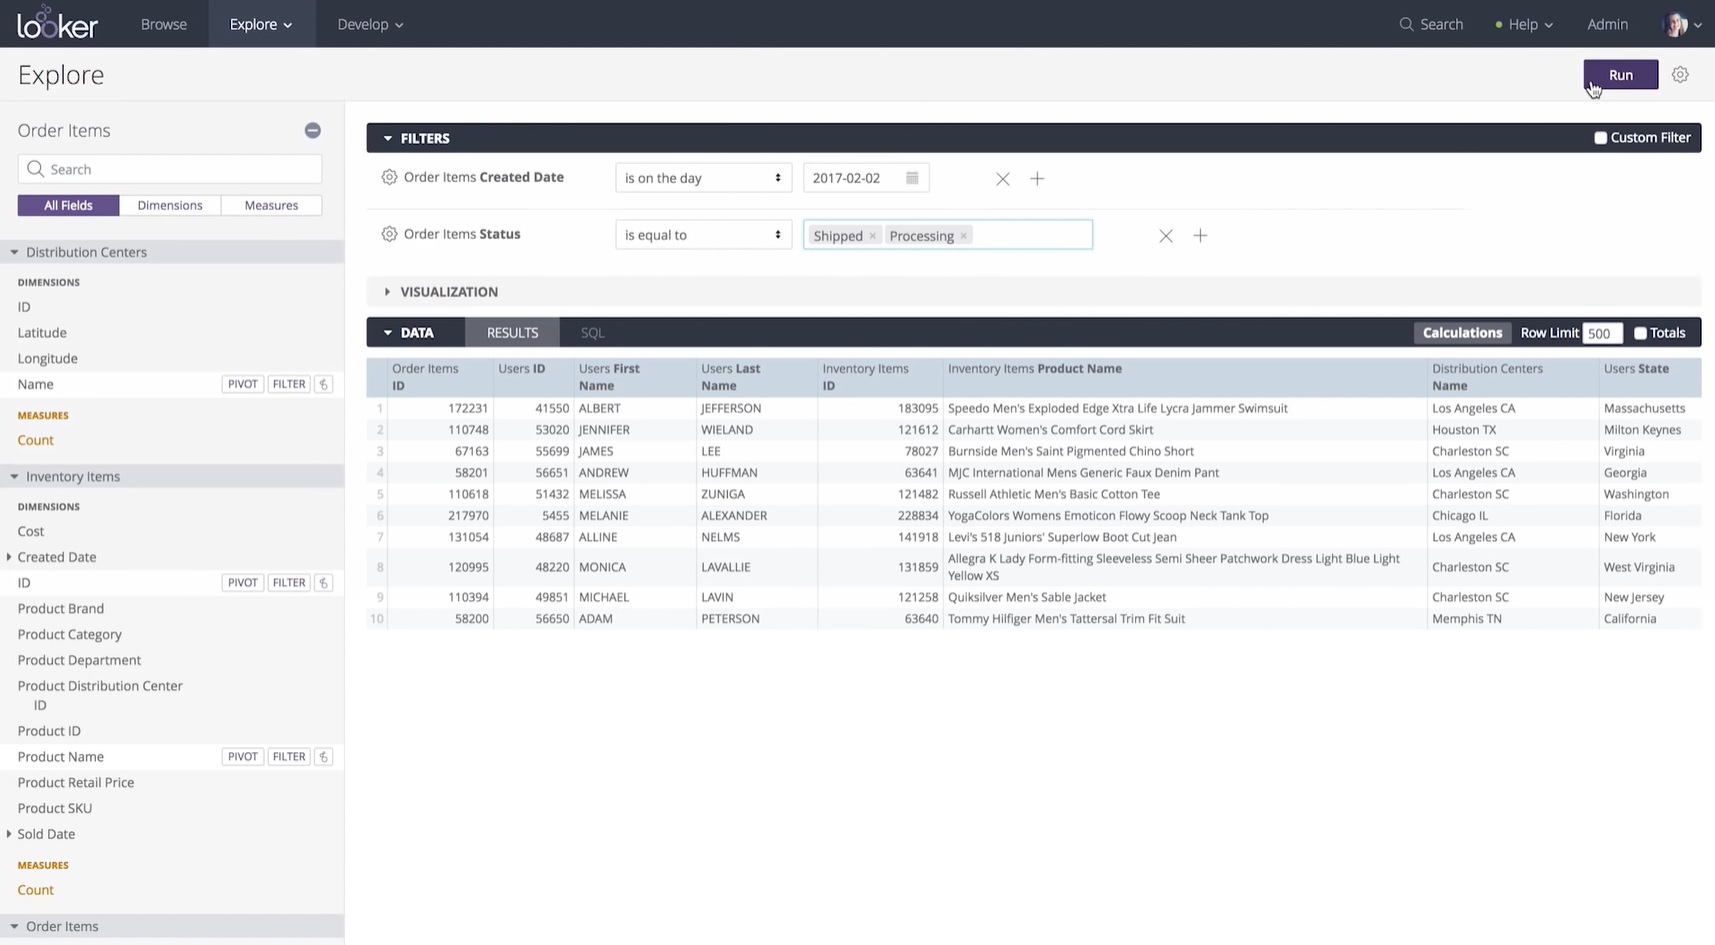
Looker is among the data analysis tools that can provide you with an easy-to-use interface, comprehensive feature set, and mobile-ready capabilities at an affordable rate.
Potential Issues in Data Analysis Software Use
Data analysis can help an organization. However, you have to do it properly and with the right software. The potential issues usually arise when people don’t do their analysis right or don’t use their software properly. Here are potential issues for adopting a data analysis software solution:
Underutilization and Learning Curve
Many times, data analysis software has more tools that you can use. Sometimes, these tools are unfamiliar to the people that use them. This is because some analysts, especially fledgling ones, are not familiar with data analysis techniques. Also, we sometimes forget that there is creativity involved when it comes to handling data. Thus, the lack of knowledge and skills affects how a software is used. In many instances, it can be underutilized.
Also, data analysis tools are becoming more user-friendly. However, data analysis per se is not that easy to master. There will be a learning curve when it comes to this too. So, you would be dealing with two learning curves. First, you have to learn how to negotiate with the software. Second, you have to know what more can you do with the program. This can take a while. Thus, it is a potential issue for rolling out the software.
Wrong or Poor Data
Sometimes, people could be using sparse data and derive general conclusions from it. This is because we have biases. Also, some business people only report good things. This, of course, is something we want to avoid. But, doctoring data is somewhat prevalent in many organizations. Also, people can use the wrong data as well. For instance, some would consider advertising and recall to judge a brand’s worth rather than its profitability. This may look good on a report, but basing decisions on this may lead a brand to bad spaces.
Slow Adoption
We have discussed the learning curve issue. And, yes, it takes a while to learn new things and use them properly and profitably. However, the learning curves discussed are mainly cognitive issues. Slow adoption can also be caused by cultural issues. There are many firms out there with not-so-responsive members to change. Many would like to just keep things the way they are. Ultimately, they get paid the same. Maybe, you have some people like this in your organization, and it is a valid viewpoint. However, you have to be ready to manage changes and let them get into the program. Often, this is very hard to do.
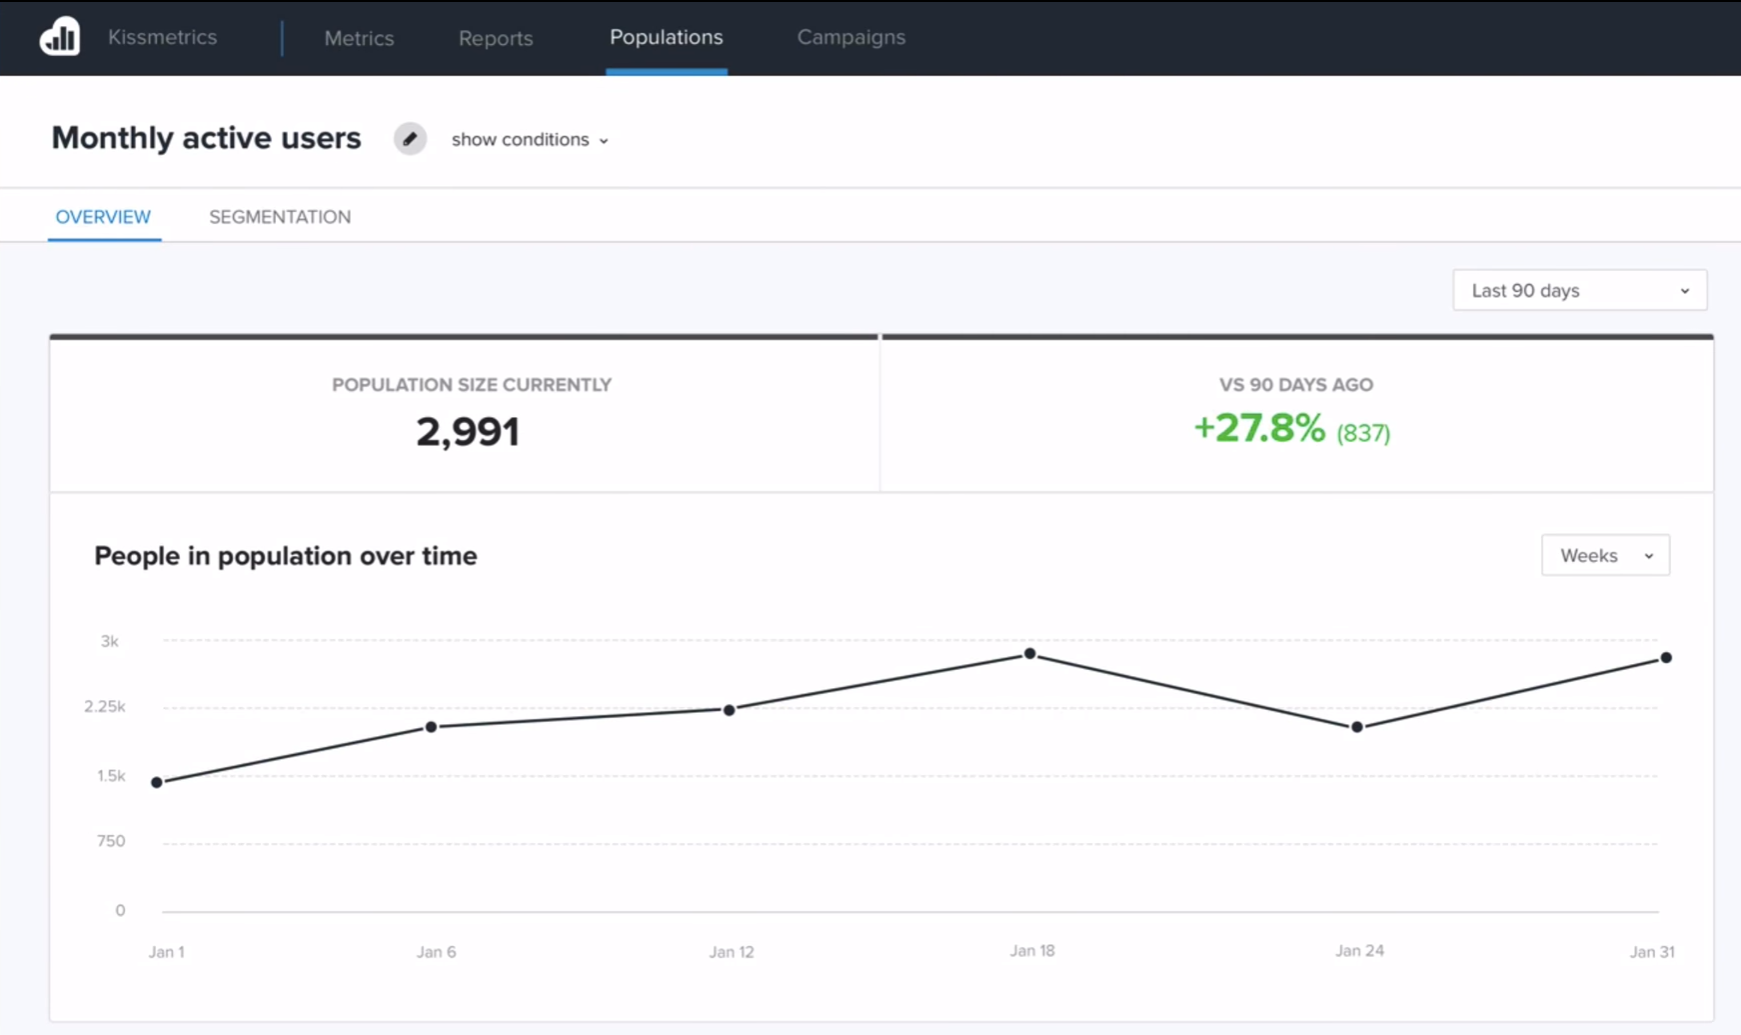
With KISSmetrics, you won’t have to worry about steep learning curves that can potentially slow down your operations.
Trends in Data Analysis Software Usage
The business intelligence (BI) and analytics platforms market is expected to reach a value of $26.78 billion this year. Also, if you combine this figure with that of big data, you’d get a market that will reach $54.1 billion in the next two years. This points to the fact that people are optimists when it comes to the rise of data analysis software adoption. One trend that comes with this is data storytelling.
Now, businesses and other organizations use data to tell stories about their pasts, present, and possible futures. Everyone wants their stories to be backed up by facts. Of course, this works best when you run a business, and the bottom line is purely quantitative. You want to create stories that explain the numbers to know how to proceed. Also, stories are pretty much easier to digest more than raw spreadsheets and charts.
This is why experts also think that shareable interactive dashboards will take the market by storm as well. Thus, many software providers will resort to making this report format available on their platforms. These interactive dashboards, plus data storytelling, will make more frequent appearances in many business boardrooms in the next few years.
Also, many believe that smaller firms will get into more data analysis as well. In fact, for BI products, it is the firms with 100 employees or less that have had the highest penetration rates. Many experts believe that this trend will continue to be strong in the next decade.