It doesn’t matter whether you are running a brick-and-mortar operation, a web-based business, or a combination of both. To remain competitive, one needs to be smart in handling information. And, many successful companies manage their information and data using business intelligence software tools. Two of the most popular tools used today are SAP Crystal Reports and Microsoft Power BI. But the question is, which one is the better application? Most importantly, which one fits your needs? We’ll try to give you an idea of how to go about answering these questions for yourself.
In this article, we’ll compare both products using three criteria: (1) features and usability, (2) packages and pricing, and (3) integrations. But, it is also worth noting that we consider both products to be well-built. However, it just seems that one is a bit superior to the other. So, before we get to our SAP Crystal Reports vs Microsoft Power BI verdict, let’s get to know the products first.
SAP Crystal Reports
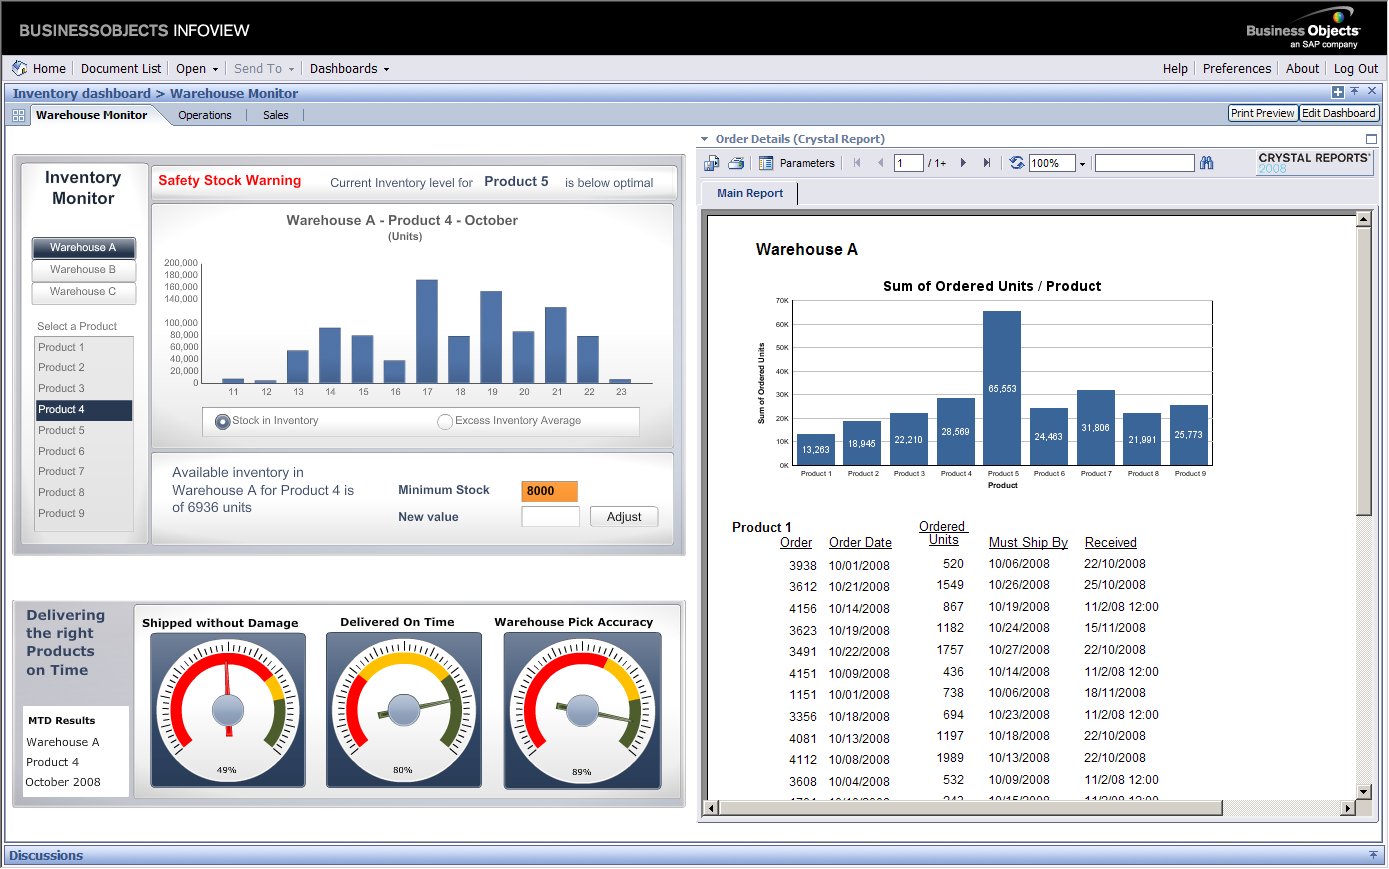
SAP Crystal Reports is a business intelligence software designed to extract and analyze data from all types of databases. This way, it allows users to make use of data, find relationships between them, and generate actionable insights. Plus, thanks to its intuitive interface, it makes it easy for users to create specialized interactive reports.
This, of course, is a technical software and it requires people with the right technical skills to man properly. Consequently, when a professional takes the reins of the software, it seems to be just second nature to them. This is how well-designed SAP Crystal Reports is.
One thing that makes it easy is that there are built-in report wizards. They help users every step of the way in building their reports and dashboards. Thus, an utter beginner will not find it hard to learn to use SAP Crystal Reports properly.
There are many visualization tools available. Crystal Reports visualization options include graphs and even geographic maps. With them, you can present explorable data and even allow viewers to drill-down into them across multiple pages.
This capability is perfect for creating what-if scenario models to explore where the business is headed based on specific data behaviors. Also, these reports are shareable through multiple platforms, including email, web, and PDF.
Moreover, SAP Crystal Reports integrates well with different types of programs to gather data and intelligence. Lastly, pricing starts at $495 per named user license. This plan is perfect for small business and individual use.
SAP Crystal Reports is a self-service BI tool offering simple and straightforward functionalities.
Microsoft Power BI
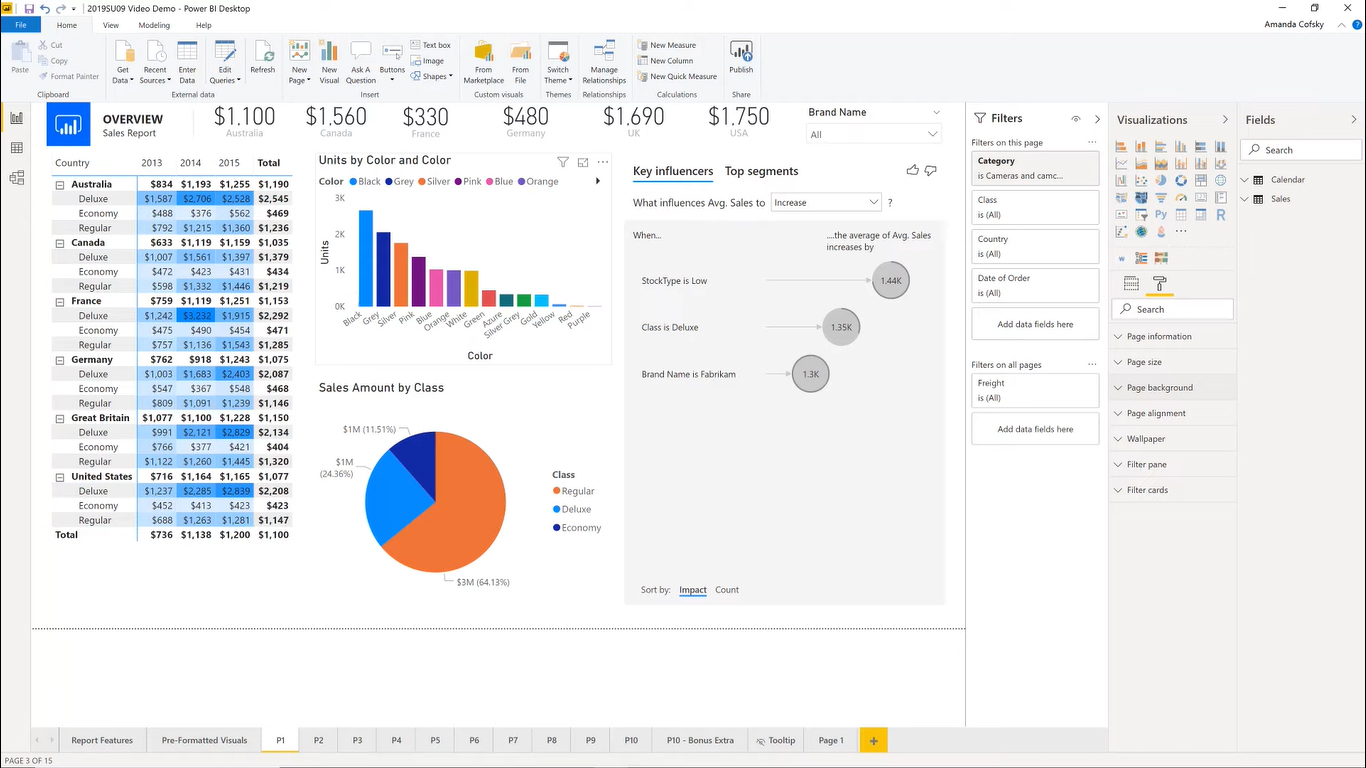
Microsoft Power BI is a comprehensive software suite for analytics. It is not a single tool but a suite of modules for gathering, analyzing, and visualizing data. Thus, many companies use this flagship BI system from Microsoft. Just like many top BI tools, it includes features like visualizations, interactive dashboards, and various statistical methods to pry open data relationships. In this way, you can use it to gain actionable business insights quickly.
What’s more, you can share these reports and dashboards via different types of devices. This makes it easy for you and your team to track business performance, growth, and financials even when you are on the go. You can be in your office or the field. You’ll get access to important metrics and immediately gauge how your business is going. This is perfect for both tactical and strategic planning.
There are also different types of deployments for Microsoft Power BI. You can have it on-premise or web-based. It even has mobile apps and the Power BI Embedded product. Embedded lets you add interactive reporting and analytics to your applications.
Lastly, Microsoft Power BI integrates well with the Microsoft suite of products, including employee tracking platforms and other business systems. These include MailChimp, GitHub, Google Analytics, and many more. Premium plans start with Power BI Pro at $9.99 a month per user. However, there is a Power BI free that’s also quite comprehensive for micro-business use.
To expand your options, be sure to check our Microsoft Power BI vs Oracle BI comparison guide.
Microsoft Power BI is an end-to-end business intelligence solution built to handle all types and sizes of data.
SAP Crystal Reports vs Microsoft Power BI Comparison
In this section, we’ll compare both products in the following criteria: (1) features and usability, (2) packages and pricing, and (3) integrations. Then we’ll give you our official SAP Crystal Reports and Microsoft Power BI comparison 2020 verdict.
1. Features and Usability
SAP Crystal Reports vs Microsoft Power BI comparison is like comparing apples and oranges. Both are self-service business intelligence tools, but one is more comprehensive than the other. This is because one is made for scalability while the other is built for small businesses. And, the one that’s designed for small business use is SAP Crystal Reports. Thus, its features are quite limited and might not be ideal for medium to large companies. On the other hand, Power BI can let you scale from small business or individual use to handling big data for large enterprises.
Also, SAP Crystal Reports’ interface is okay. It is not great. In all honesty, our review team finds it reminiscent of an old Microsoft Office interface. So, why settle for an older looking one similar to a Microsoft product when you can get a modern interface from a modern Microsoft product? Well, one reason for this is that SAP Crystal Reports integrates well with other robust SAP systems. But, when you are starting fresh, it just seems Microsoft Power BI is a better choice.
Moreover, if you are already using Microsoft products for your reports like Excel, Power BI is the most natural step up. Plus, you get a free account to toy around with too.
Additionally, Power BI has different types of deployment and products. You get a mobile version and even get the Embedded product where you can add interactive reports and analytics to your in-house applications as well.
So, for usability, scalability, flexible deployment, and comprehensiveness of features, we’ll give it to Microsoft Power BI. However, if you need a BI tool for small business use that can be deployed on-premise, SAP Crystal Reports is never a wrong choice.
2. Packages and Pricing
SAP Crystal Reports has limited offerings compared to Microsoft Power BI. The latest version is the SAP Crystal Reports 2016, and it is priced at $495. It’s good for small businesses as it can be installed on multiple computers for exclusive use. Plus, this is a non-expiring license. The main difference between these plans is the number of report recipients.
On the other hand, Power BI has a free version that is good for individuals and micro to small businesses. However, if you want more features like sharing interactive dashboards, then you should choose Power BI Pro. This costs $9.99 per user per month, and it is excellent for collaboration, sharing, and even ad hoc analysis. But, if you represent a large enterprise, we recommend you opt for the $4,995 Power BI Premium. This allows for enterprise-wide BI and big data capabilities. What’s more, is that you get both on-premise and cloud reporting.
Also, as mentioned, the Power BI suite has other products, including Embedded. Plus and Auto ML. This machine learning tool can help your analysts build ML models to solve business problems. You don’t have to be an expert in data science to have this capability. All you need is a powerful self-service, end-to-end BI tool, and that is Microsoft Power BI.
So, in these criteria, Microsoft Power BI takes the win.
3. Integrations
The set of available integrations is a critical point of comparison when it comes to BI platforms. Firstly, you want your BI platform to gather data from different channels and file types quite seamlessly. And, if you are a heavy Microsoft user, then your platform of choice will be Power BI. On the other hand, if your company is a heavy SAP user, you might as well choose SAP Crystal Reports. Keeping with the same brand of products ensures seamless integrations.
Also, Microsoft Power BI integrates well with other business systems from other popular providers. Integrations include those for MailChimp, QuickBooks, and Salesforce, among many others. On the other hand, because SAP Crystal Reports is an on-premise solution, it is harder to integrate with web-based SaaS solutions.
From what we know, there are more problems when it comes to integration with SAP Crystal Reports than with Power BI. Also, to integrate it with other programs, one needs to have technical knowledge. And, if you are strictly an analyst and not an IT person, then you’d have a harder time.
So, in this regard, we’ll give the win again to Microsoft Power BI.
What’s the Better BI Platform?
As we end our SAP Crystal Reports vs Microsoft Power BI comparison, we have concluded that Power BI is the better platform. This is because it has more comprehensive features. This naturally follows as it is a suite of products rather than just a standalone BI solution. Plus, it is flexible in terms of deployment and is a hybrid system. It is also scalable in terms of being able to service a wide range of users from individuals to large enterprises.
However, SAP Crystal Reports is in no way a lesser tool. When it comes to pure self-service analytics and reporting features, it rivals Microsoft Power BI. You can do almost the same things on both platforms. So, it is really a formidable software. And, if you are an individual user or represent a small business, you’d save on money when you buy a lifetime license. It’s just that Power BI has more supporting features that make it more usable and powerful.
Lastly, check out our data analysis software guide to learn more about how you make sense of your business data for better decision-making.