

Customer service quality used to be easier to measure. You looked at how quickly agents responded, how many tickets they resolved, how satisfied customers were, and whether issues were closed within SLA. Metrics like CSAT, NPS, CES, first-contact resolution, average handle time, and resolution time gave support leaders a fairly reliable read on team performance.
AI has changed that.
Today a customer issue may be answered by an AI agent, suggested to a human agent, escalated after partial automation, resolved through self-service, or handed off across several channels. Traditional support metrics still matter, however, they no longer tell the full story.
Speed alone hides a lot. A fast AI response is not always a good one. A deflected ticket has not necessarily been resolved, and lower handle time can even mask a worse experience underneath.
Because of that, customer service quality in the AI age has to be measured across four layers: customer experience, resolution accuracy, AI performance, and human handoff quality. Automating more tickets is only half the objective. The real aim is to resolve the right issues accurately, keep customer effort low, protect trust, and free human agents to focus where they add the most value.
Why Traditional Customer Support Metrics Are No Longer Enough
Traditional customer support metrics were built for a simpler operating model. A customer raised a ticket on your helpdesk, a human agent replied, investigated the issue, shared a solution, and closed the conversation. Support leaders then measured how fast the agent responded, how long the issue took to resolve, how satisfied the customer was, and how many tickets the team handled.
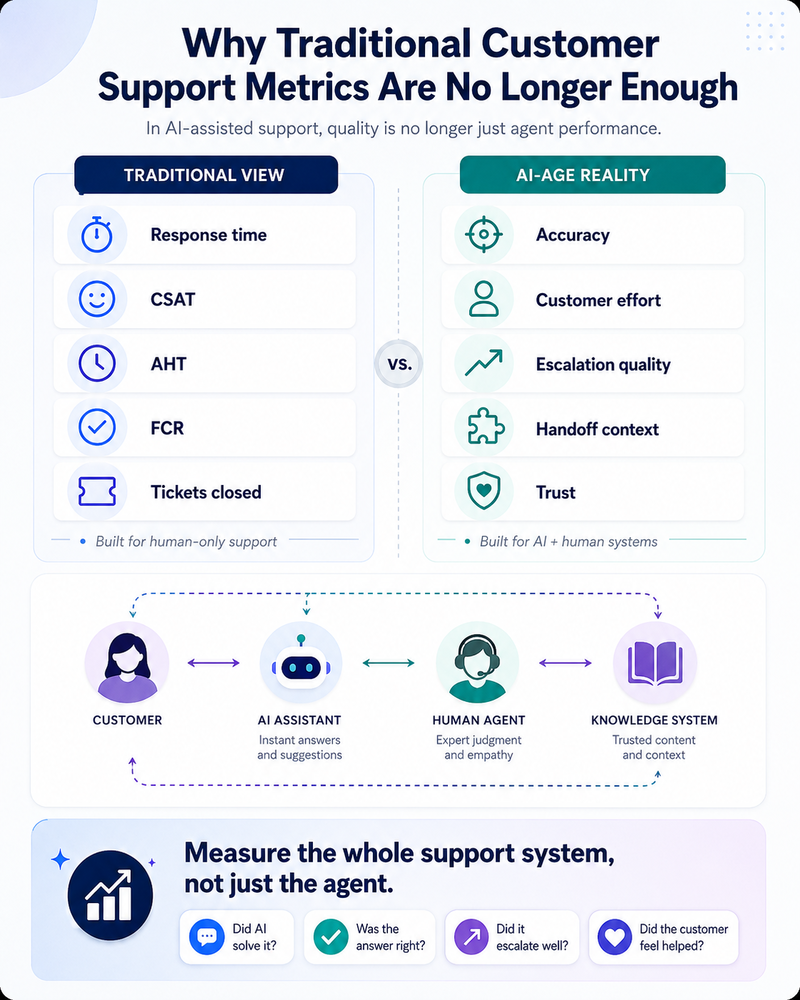
That model still exists, but it is no longer the only one. In AI-assisted support, the work is split across systems and people. AI may answer the first question, summarize the ticket, suggest a reply, route the issue, ask follow-up questions, or resolve the interaction without a human agent ever joining the conversation. So support quality has become a measure of the whole support system rather than any single agent’s performance.
For teams evaluating an AI customer support tool, the right starting point is not “how many tickets can AI deflect?” It is “which customer issues can AI resolve accurately, safely, and measurably?”
In fact, AI customer support tools like Kayako only charge their customers based on resolved queries and not for the tool usage itself.
This distinction matters because AI can also improve the numbers while weakening the experience underneath them.
Take deflection first. A chatbot can reduce ticket volume by keeping customers away from agents, yet if those customers are stuck in loops, the metric looks healthy while the experience gets worse.
First response time behaves the same way. AI can pull it down to a few seconds, but a generic, incomplete, or wrong answer has not improved service quality. Handle time is trickier still.
Automation lowers average handle time on routine work, though human agents may see their own handle time rise once they are left with only the most complex, emotional, and risky tickets, even as the operation as a whole grows more efficient.
This is why traditional metrics need to evolve.
CSAT still counts, though it should be segmented by AI-only, human-only, and AI-assisted conversations. First-contact resolution matters too, but only when it is checked against reopen rate and repeat contact rate. Average handle time stays useful once you read it alongside ticket complexity. Deflection belongs on the list as well, yet only when the customer’s issue is actually resolved.
In the AI age, support leaders have to measure more than speed and volume. The harder questions are whether customers got the right answer, whether AI knew when to escalate, whether agents received enough context, and whether the system as a whole improved after each interaction.
The New Customer Service Quality Framework
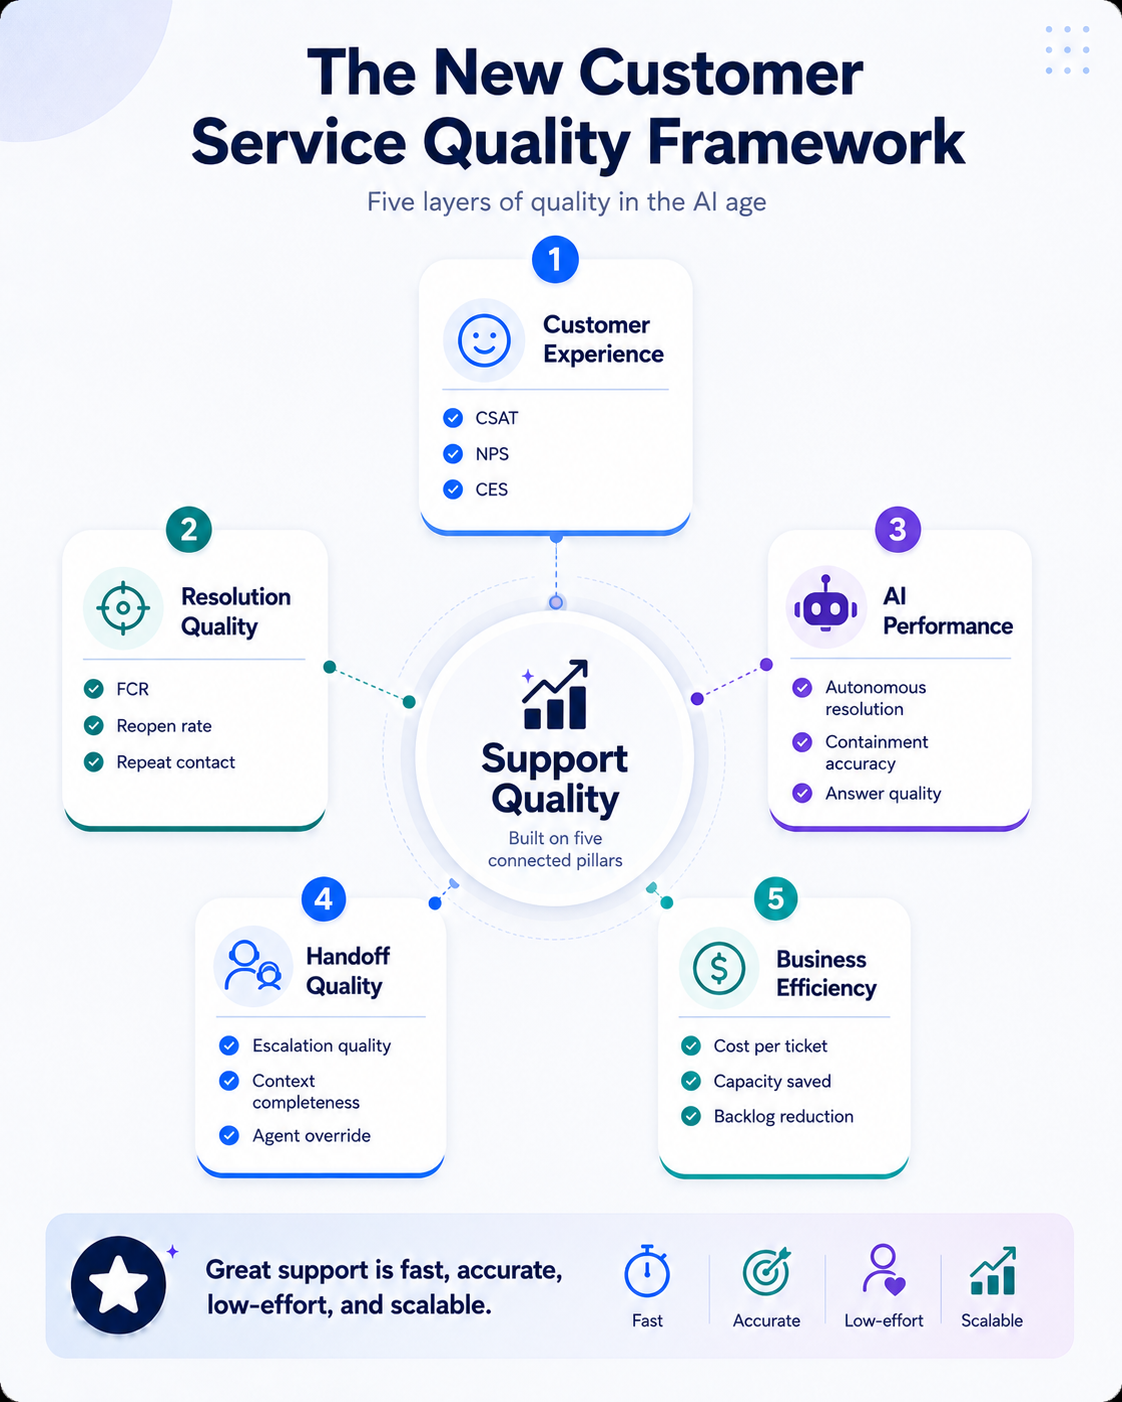
In the AI age, customer service quality cannot be captured in a single score. A good support experience now depends on five things: how the customer felt, whether the issue was actually resolved, how accurately AI performed, how smoothly the handoff worked, and whether support grew more efficient without eroding trust. Here is the framework support leaders should use.
1. Customer Experience Metrics
These metrics show how customers feel after a support interaction. They include CSAT, NPS, CES, sentiment score, and complaint rate. They still matter because AI is supposed to make the customer experience better. Lightening the team’s workload is a welcome side effect, not the measure of success. The key is to track each one separately for AI-only, human-only, and AI-assisted conversations.
2. Resolution Quality Metrics
These metrics show whether the customer’s issue was actually solved. They include first-contact resolution, reopen rate, repeat contact rate, escalation rate, and resolution accuracy. This layer matters because a ticket can be closed without the customer being fully helped. In AI support especially, “closed” should never be treated as a synonym for “resolved.”
3. AI Performance Metrics
These metrics show how well AI is doing its job. They include autonomous resolution rate, containment accuracy, AI answer acceptance rate, hallucination rate, knowledge gap rate, and escalation accuracy. Here teams move past basic deflection and start measuring whether AI is safe, whether it is actually useful, and whether it improves over time.
4. Handoff Quality Metrics
These metrics show how well AI and human agents work together. They include AI-to-human handoff quality, context completeness, escalation appropriateness, agent override rate, and post-handoff resolution time. This matters because a bad handoff produces one of the most frustrating experiences a customer can have, which is explaining the same issue all over again.
5. Business Efficiency Metrics
These metrics show whether support quality is improving at a sustainable cost. They include cost per resolved ticket, cost per AI resolution, agent capacity saved, backlog reduction, SLA achievement, and support cost as a percentage of revenue.
Together, these five layers give support leaders a fuller view of quality. Faster support is not the finish line. What teams are really after is support that stays accurate and low-effort, keeps customers’ trust, and scales as volume grows.
Core Customer Service Quality Metrics and How to Calculate Them
Traditional customer service metrics still matter in AI-assisted support, and most modern customer service software AI-to-human handoff reports them out of the box. The difference now is that they need to be segmented, interpreted in context, and paired with AI-specific metrics. Here are the core measures every support team should keep tracking.
Customer Satisfaction Score, CSAT
CSAT measures how satisfied customers are after a support interaction.
Formula: CSAT = Positive responses / Total responses x 100
For example, if 800 out of 1,000 customers give a positive rating, your CSAT is 80%. In most support teams, a score between 80% and 90% is considered strong, while anything below 70% usually needs attention.
In the AI age, a single blended CSAT number hides too much, so segment it by:
- AI-only conversations
- Human-only conversations
- AI-assisted conversations
- AI-to-human escalations
That segmentation shows you where the experience holds up and where it breaks. If AI-only CSAT is high while escalated CSAT is low, the problem probably is not the AI answer itself. More often, it is the handoff.
Net Promoter Score, NPS
NPS measures customer loyalty. It asks customers how likely they are to recommend your company to others.
Formula: NPS = % Promoters – % Detractors
A score above 30 is generally good, and above 50 is excellent. NPS is useful because it shows whether your overall customer experience is building trust. However, it should not be used alone to judge AI support quality.
A customer may give a low NPS because of product issues, pricing, onboarding, or account management, so support may be only one part of the problem. Treat NPS as a read on long-term trust, and lean on CSAT, CES, FCR, and the AI quality metrics when you want to judge support performance itself.
Customer Effort Score, CES
CES measures how easy it was for a customer to get help. It usually asks something like, “How easy was it to resolve your issue today?” Customers answer on a scale, often 1 to 5 or 1 to 7.
Lower effort tends to signal a better experience, which makes CES one of the most telling metrics in AI support. Good AI lowers effort by answering faster, cutting repetitive back-and-forth, and clearing simple issues before a customer has to wait. Track CES across channels:
- AI self-service
- Live chat
- Help center
- Escalated tickets
Teams that rely heavily on chat should also compare channel-level performance. This guide to the best live chat software can help evaluate how live chat tools support speed, routing, automation, and customer experience.
First-Contact Resolution, FCR
FCR measures how often customer issues are resolved in the first interaction.
Formula: FCR = Tickets resolved on first contact / Total resolved tickets x 100
A strong FCR rate is usually 75% or higher, though the right benchmark depends on ticket complexity. In AI-assisted support, FCR should be measured separately for:
- AI-only resolution
- Human resolution
- AI-assisted human resolution
- Escalated resolution
This matters because AI can make FCR look better than it is. If a customer does not reopen a ticket but later contacts support again for the same issue, the first interaction was not truly resolved. For that reason, pair FCR with repeat contact rate, reopen rate, and CSAT to get a more accurate picture.
Average Handle Time, AHT
AHT measures the average time agents spend handling customer interactions.
Formula: AHT = Total handle time / Number of handled interactions
On repetitive tickets, AI should pull this number down. A landmark study of more than 5,000 support agents found that giving agents a generative AI assistant raised issues resolved per hour by about 14%, with the largest gains, close to 34%, going to newer and lower-skilled staff. However, once AI is in place, the AHT of your human agents can actually climb.
That does not automatically mean they are performing worse. More likely, AI is clearing the simple issues while people handle the complex, emotional, or high-risk tickets, and those naturally take longer. So read AHT alongside ticket complexity, escalation rate, and customer satisfaction, and avoid penalizing agents for longer handle times when the nature of their work has changed.
First Response Time
First response time measures how long a customer waits for the first reply.
Formula: First Response Time = Time of first response – Time of ticket creation
AI can make that first response almost instant, yet instant does not always mean useful. A better gauge in the AI age is “time to useful response.” A useful response moves the customer closer to resolution, whether it answers the question, asks the right clarifying question, shares the correct next step, or routes the person to the right place. A fast but generic reply should not count as quality support.
Time to Resolution
Time to resolution measures the total time it takes to solve a customer issue.
Formula: Time to Resolution = Resolution time – Ticket creation time
This is one of the clearest measures of support quality because customers care about outcomes. They want the issue solved, and an acknowledgment on its own does not count. In AI support, track resolution time by category:
- AI-only resolution time
- Human resolution time
- Escalated ticket resolution time
- High-priority issue resolution time
- Billing, technical, account, and product issue resolution time
This helps you see which ticket types AI is improving and which ones still need human expertise.
Reopen Rate
Reopen rate measures how often customers reopen tickets that were marked as resolved.
Formula: Reopen Rate = Reopened tickets / Resolved tickets x 100
A reopen rate below 5% is usually healthy, while anything above 10% may indicate a quality problem. In AI support, this metric is critical. A high reopen rate after AI resolution means the AI may be closing tickets too early, misunderstanding the issue, or giving incomplete answers. In practice, reopen rate protects your team from mistaking automation for resolution. If tickets are being closed faster but reopened more often, service quality has not improved.
New AI Customer Support Metrics Every Team Should Track
AI adds a new layer to customer service measurement, and the stakes keep climbing. Gartner projects that by 2029, agentic AI will autonomously resolve 80% of common customer service issues without human intervention, trimming operational costs by roughly 30%. As more of the queue runs on AI, it is no longer enough to know how many tickets closed or how quickly the first reply went out.
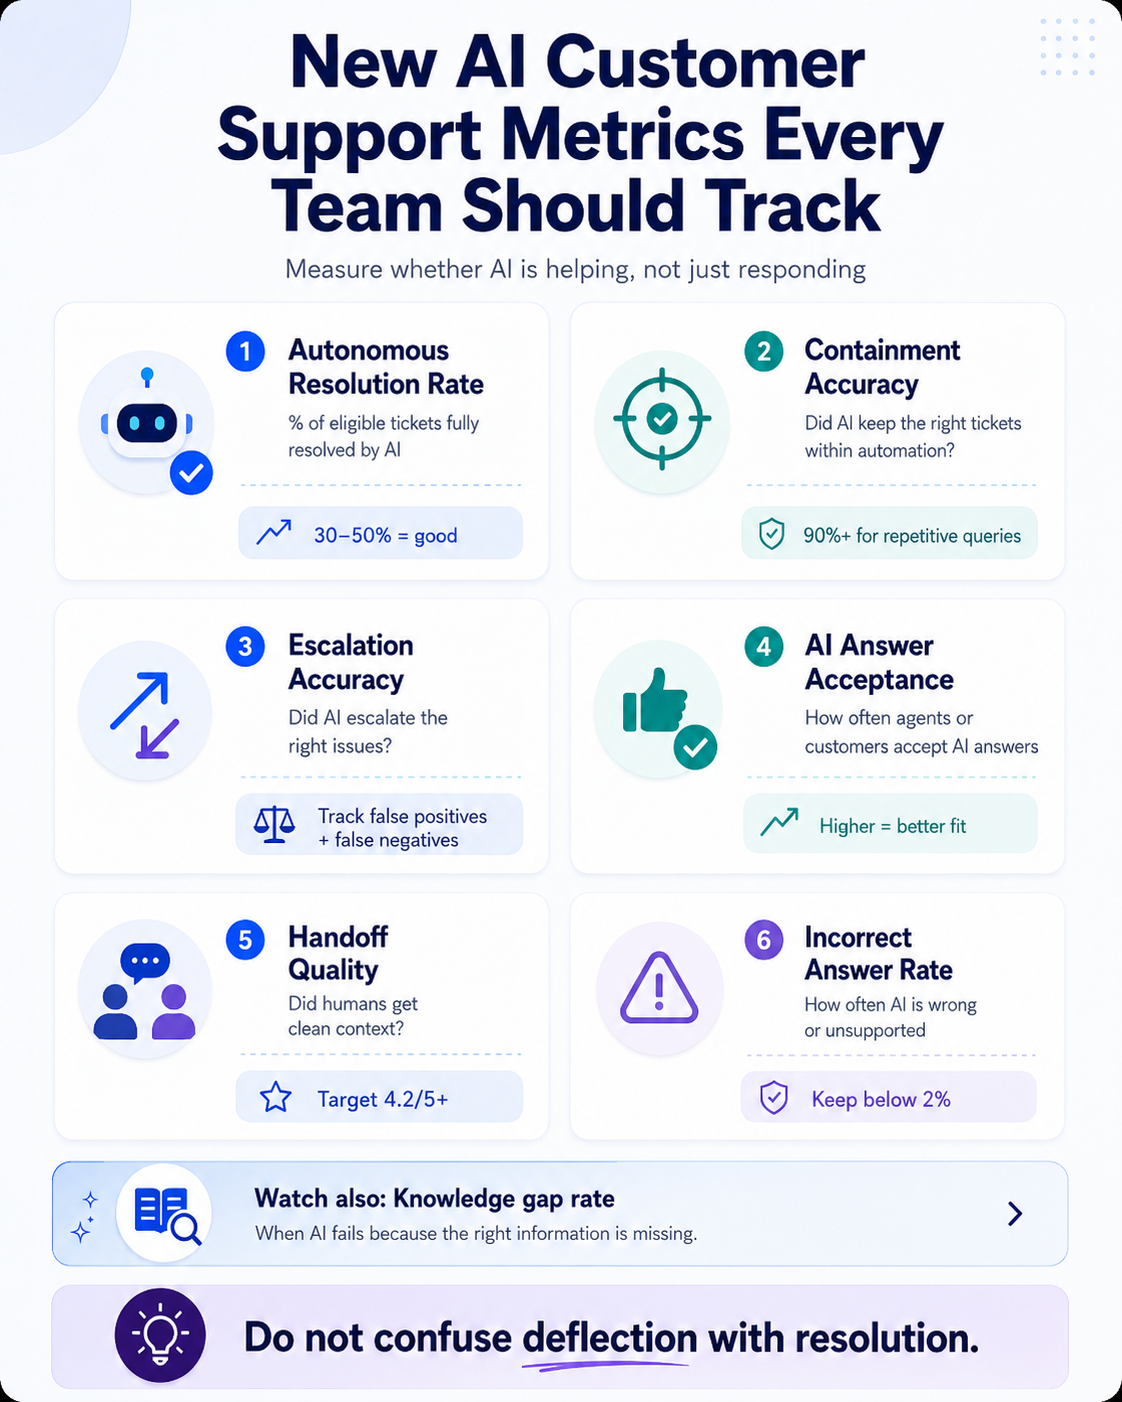
Support leaders also have to know whether AI understood the issue, answered correctly, escalated at the right moment, and left the customer better off. These are the AI-specific metrics worth tracking.
Autonomous Resolution Rate
Autonomous resolution rate measures the percentage of customer issues resolved by AI without human involvement.
Formula: Autonomous Resolution Rate = AI-resolved tickets without human intervention / Total eligible tickets x 100
For example, if AI resolves 2,000 out of 5,000 eligible tickets, the autonomous resolution rate is 40%. This metric is useful because it shows how much work AI is taking off the human support team, though it should be measured carefully. Only count a ticket as autonomously resolved if the customer’s issue was actually solved, and do not count tickets that were simply deflected, abandoned, or closed without confirmation.
A healthy benchmark depends on ticket type:
- 10% to 30%: Early-stage AI adoption
- 30% to 50%: Good automation maturity
- 50% to 70%: Strong for repetitive support queues
- 70%+: Excellent, but should be audited for accuracy
This metric works best for predictable queues such as password resets, order status, billing FAQs, account access, delivery updates, and basic troubleshooting, the kind of high-volume, low-variance requests that most customer support software now automates by default.
Containment Accuracy
Containment accuracy measures whether AI correctly kept a conversation within automation instead of escalating it to a human agent.
Formula: Containment Accuracy = Correctly contained AI interactions / Total contained AI interactions x 100
This is different from containment rate. Containment rate only tells you how many conversations stayed with AI, whereas containment accuracy tells you whether those conversations should have stayed with AI. That distinction matters. A bot can raise containment by making it hard for customers to reach an agent, but that is not good support, since it only hides frustration inside the automation layer. As a rule, a strong containment accuracy rate sits above 90% for low-risk, repetitive queries, and anything below 80% should be reviewed, because it may mean AI is handling issues it should escalate.
AI Escalation Accuracy
AI escalation accuracy measures whether AI escalates the right issues to human agents.
Formula: AI Escalation Accuracy = Correct AI escalations / Total AI escalations x 100
There are two types of escalation errors to track. A false positive happens when AI escalates an issue that it could have resolved, and a false negative happens when AI tries to resolve an issue that should have gone to a human. False positives reduce efficiency, whereas false negatives damage customer trust. For example, if AI escalates a simple password reset, it wastes agent time. On the other hand, if AI tries to handle a billing dispute, legal complaint, angry customer, security issue, or medical inquiry without escalation, the risk is much higher. This is why escalation accuracy should be reviewed by intent, priority, and customer segment.
AI Answer Acceptance Rate
AI answer acceptance rate measures how often AI-generated answers are accepted by agents or customers.
Formula: AI Answer Acceptance Rate = Accepted AI answers / Total AI answers suggested x 100
This metric applies to both agent-facing and customer-facing AI. For agent-facing AI, it shows how often agents use suggested replies without major edits. For customer-facing AI, it shows how often customers accept the answer without asking again, reopening the ticket, or escalating.
Low acceptance usually means one of five things:
- The answer is inaccurate
- The answer is incomplete
- The answer does not match the brand voice
- The knowledge source is outdated
- The AI does not understand the customer’s intent
This metric is useful because it connects AI quality to real usage. If agents keep rewriting AI replies, the tool may be creating more work than it saves.
AI-to-Human Handoff Quality
AI-to-human handoff quality measures how smooth the transition is when AI escalates a conversation to a human agent. This is one of the most important AI support metrics, because a bad handoff creates a poor customer experience. Customers should not have to repeat everything they already told the AI.
A good handoff should include:
- Customer issue summary
- Customer intent
- Steps already attempted
- Relevant order, account, or product context
- Urgency level
- Reason for escalation
You can measure handoff quality using a QA score from 1 to 5.
Formula: Average Handoff Quality Score = Total handoff QA score / Number of reviewed handoffs
A score below 3.5 usually means agents are not getting enough context, while a score above 4.2 suggests the handoff is working well. The goal is simple: when a human agent joins, they should already know what happened, what the customer needs, and what to do next.
AI Hallucination or Incorrect Answer Rate
AI hallucination rate measures how often AI gives an incorrect, unsupported, outdated, or fabricated answer. In fact, Forbes OpenAI reported that o3 and o4-mini models have hallucinated 30-50% of the time, according to company tests, for reasons that aren’t entirely clear.
Formula: Incorrect Answer Rate = Incorrect AI responses / Total audited AI responses x 100
This metric should be tracked through regular QA audits. For low-risk support queries, an incorrect answer rate below 2% is strong, between 2% and 5% needs monitoring, and anything above 5% is a serious quality risk. For regulated industries such as finance, healthcare, insurance, and legal services, the acceptable threshold should be much stricter.
This metric is important because one wrong AI answer can create more damage than a slow response. It can mislead customers, increase liability, create compliance issues, and reduce trust in the support experience. Customers are naturally wary of AI models because of this.
Knowledge Gap Rate
Knowledge gap rate measures how often AI fails because the right information is missing, outdated, or unclear in the knowledge base.
Formula: Knowledge Gap Rate = AI failures caused by missing knowledge / Total AI failures x 100
AI support quality depends heavily on the quality of the knowledge it uses. If the knowledge base is incomplete, AI will either escalate too often or answer poorly, and if the knowledge base is outdated, AI may confidently provide the wrong information. Track the top knowledge gaps every week, then use them to update help articles, internal macros, product documentation, and support workflows. This turns AI measurement into a feedback loop, where every failed answer becomes a signal for what the support system needs to learn next.
Benchmark Ranges for Customer Service Quality Metrics
Customer service benchmarks are useful, but they should not be treated as universal rules. A B2B SaaS company handling technical troubleshooting will not have the same resolution time as an ecommerce brand answering order-status questions, and a fintech team handling fraud claims will have different escalation standards than a retail team handling returns.
Use benchmarks as directional signals, then adjust them by industry, ticket type, channel, customer segment, and issue complexity. Vendor comparison guides, such as Research.com’s roundup of customer service software for enterprises, are a useful reference for how widely these baselines vary by company size and sector.
| Metric | Formula | Healthy Benchmark | Best Used For |
| CSAT | Positive responses / Total responses x 100 | 80% to 90% | Measuring interaction satisfaction |
| NPS | % Promoters – % Detractors | 30+ is good, 50+ is excellent | Measuring customer loyalty |
| CES | Average effort score | Lower is better | Measuring ease of getting help |
| First-Contact Resolution | First-contact resolutions / Total resolved tickets x 100 | 75%+ | Measuring resolution quality |
| Reopen Rate | Reopened tickets / Resolved tickets x 100 | Below 5% | Identifying incomplete resolutions |
| Autonomous Resolution Rate | AI-resolved tickets / Eligible tickets x 100 | 30% to 70% | Measuring AI maturity |
| Containment Accuracy | Correctly contained AI interactions / Total contained AI interactions x 100 | 90%+ | Measuring AI reliability |
| AI Escalation Accuracy | Correct AI escalations / Total AI escalations x 100 | 90%+ | Measuring escalation judgment |
| AI Handoff Quality | Total handoff QA score / Reviewed handoffs | 4.2/5+ | Measuring AI-to-human transition |
| Incorrect Answer Rate | Incorrect AI responses / Audited AI responses x 100 | Below 2% | Measuring AI safety and accuracy |
| Knowledge Gap Rate | AI failures caused by missing knowledge / Total AI failures x 100 | Should decline over time | Improving knowledge quality |
| Cost per Ticket | Total support cost / Tickets resolved | Should decline over time | Measuring support efficiency |
What matters most is not whether a single metric clears a generic benchmark. The real question is whether the system as a whole is getting better. For instance, if autonomous resolution climbs while CSAT falls, AI is probably resolving the wrong tickets or giving weak answers. A rising first-contact resolution paired with a climbing reopen rate suggests tickets are being closed too early. And when cost per ticket drops but NPS slides, the efficiency is likely coming at the expense of trust.
The best support teams look at these metrics together. They measure whether AI is reducing cost, improving speed, protecting accuracy, and making the customer experience easier.