
You built the course. You recorded the videos, wrote the lessons, structured the quizzes. And then the students arrived — and some of them quietly disappeared halfway through.
No warning. No feedback. Just silence.
If you’ve ever stared at a course dashboard wondering why learners drop off at lesson four, or why quiz scores nosedive after a specific module, you already understand the problem that learning analytics was built to solve.
Online education is booming. The global eLearning market is projected to reach $370–400 billion in 2026, up from $325 billion in 2025 . But more learners doesn’t automatically mean more engaged learners. The difference between a course that transforms and one that gathers dust? Data — and knowing how to use it.
This guide breaks down everything online course creators need to know about learning analytics: what it is, how it works, which metrics actually matter, and how to turn raw numbers into a more engaging, higher-converting course experience.

What Is Learning Analytics? (And Why It’s Not Just a Buzzword)
Learning analytics is the measurement, collection, analysis, and reporting of data about learners and their contexts — with the goal of understanding and improving learning outcomes.
In practical terms? It’s your LMS telling you:
- Which lesson made 60% of your students stop watching
- Which quiz question every struggling learner gets wrong
- How long a learner spends on each module before moving on
- Who hasn’t logged in for two weeks — before they quietly quit
The term was formally introduced at the 1st International Conference on Learning Analytics in 2011, but the underlying practice — using learner data to improve teaching — is as old as education itself. What’s new is the scale, speed, and sophistication with which modern LMS platforms collect and surface that data.
In 2026, learning analytics has expanded far beyond basic completion dashboards. Today it covers AI-driven insights that surface at-risk learners, recommend personalized next steps, measure learning ROI, and inform instructional design decisions at every level .
Key Insight: Without learning analytics, course creators are making design decisions based on gut feeling. With it, every update is informed by evidence.
The 4 Types of Learning Analytics Every Course Creator Should Know
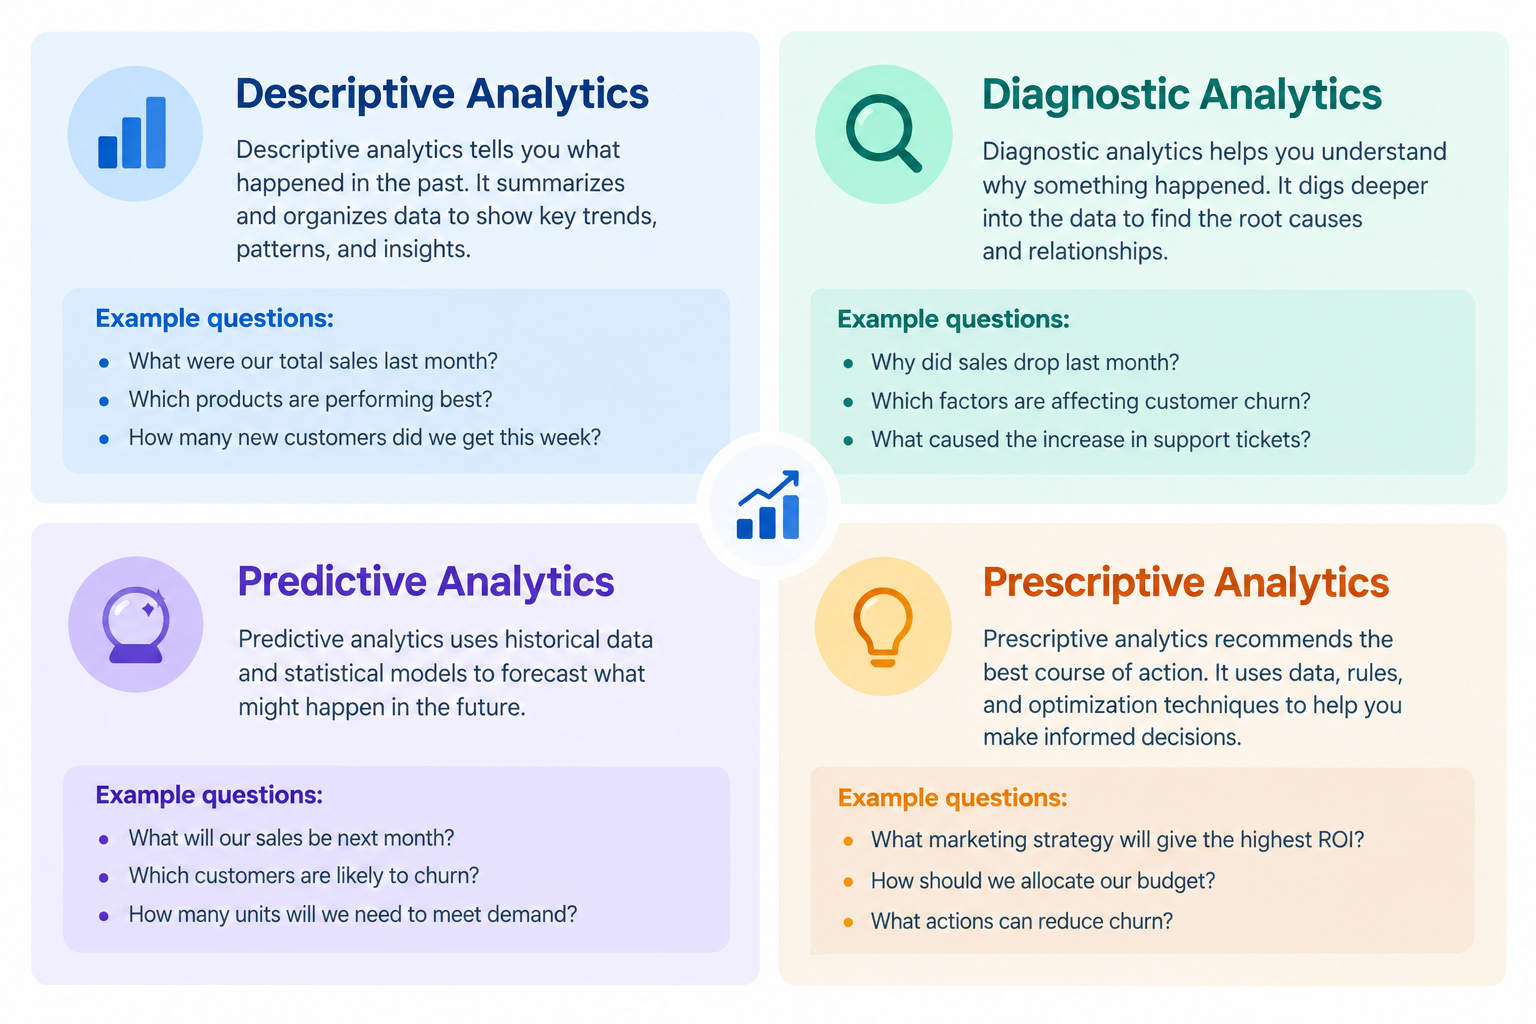
Understanding what kind of analysis you’re doing shapes the decisions you can make. The Society for Learning Analytics Research identifies four core methodologies.
1. Descriptive Analytics — What Happened?
This is the foundation. Descriptive analytics looks backward: it tells you your course completion rates, average quiz scores, login frequency, and engagement rates. It answers the question “What are my learners actually doing?”
Think of it as your rear-view mirror — essential context before you change direction.
2. Diagnostic Analytics — Why Did It Happen?
When your completion rate drops at lesson seven, diagnostic analytics helps you understand why. Was the content too dense? Was the video too long? Did learners lose the thread because a prerequisite concept wasn’t clear?
This layer turns data points into patterns — and patterns into hypotheses you can test.
3. Predictive Analytics — What Will Happen Next?
Predictive analytics uses historical learner data to forecast future outcomes like course completion, skill attainment, or dropout risk . Using models like decision trees and regression analysis, it answers: “Which of my current learners are likely to disengage — before they actually do?”
This is where analytics becomes proactive rather than reactive. Identify at-risk students early, intervene with a targeted message or resource, and watch your completion rates climb.
4. Prescriptive Analytics — What Should I Do About It?
The most advanced layer. Prescriptive analytics generates actionable recommendations based on data — for example, automatically sending a re-engagement email to a learner who hasn’t logged in for a defined number of days
💡 Most course creators stop at descriptive analytics. The real competitive edge comes from building toward predictive and prescriptive insights — even at a basic, automated level.
Why Learning Analytics Matters for Online Course Creators
Here’s the honest reality of online education: most courses have a completion problem.
Community-integrated courses — those with live sessions and peer support — see completion rates of 85–90%. Standard self-paced courses? Often far lower. The gap isn’t always about content quality. It’s about knowing when and where learners lose momentum — and acting on it.
Learning analytics closes that gap by giving you:
✅ Real-Time Visibility into Learner Behavior
Rather than waiting until the end of a course cycle, you see engagement as it happens. Which lessons generate the most interaction? Where do learners rewind and re-watch? Where do they skip ahead — a signal the content isn’t adding value?
✅ Data-Driven Course Optimization
LMS analytics provide valuable feedback on which parts of a course are most and least engaging, enabling instructors to fine-tune content for maximum learner engagement and knowledge retention . A hunch that a video would help learners grasp a concept becomes testable — and if the data shows most learners aren’t finishing the video, you know the hypothesis was wrong..
✅ Personalized Learning Paths
When you know that learner A is speeding through foundational content while learner B is stuck on the same module for three sessions, you can serve them differently. AI-powered personalization — a key 2026 eLearning trend — helps create adaptive, dynamic experiences that keep learners engaged and improve outcomes.
✅ Higher ROI on Course Development
Understanding which courses deliver the most value helps you prioritize where to invest development effort. By analyzing which content is most beneficial and engaging, you can optimize training investments for higher return.
Key Learning Analytics Metrics That Actually Move the Needle
Not all data is equally useful. Here’s a focused breakdown of the metrics that give course creators the most actionable insight:
| Metric | What It Tells You | Why It Matters |
| Course Completion Rate | % of enrolled learners who finish | Core health metric for course effectiveness |
| Lesson Drop-Off Rate | Where learners stop engaging | Identifies weak or overwhelming content |
| Time on Content | How long learners spend per lesson | Signals difficulty, engagement, or irrelevance |
| Quiz Performance by Question | Which questions learners get wrong | Reveals knowledge gaps or unclear instruction |
| Login Frequency | How often learners return | Predicts at-risk learners before dropout |
| Video Engagement Rate | Rewatch, skip, and pause patterns | Shows which video segments land — and which don’t |
| Assignment Submission Rate | Completion of active learning tasks | Reflects active participation, not just passive viewing |
How Learning Analytics Improves Student Engagement — Step by Step
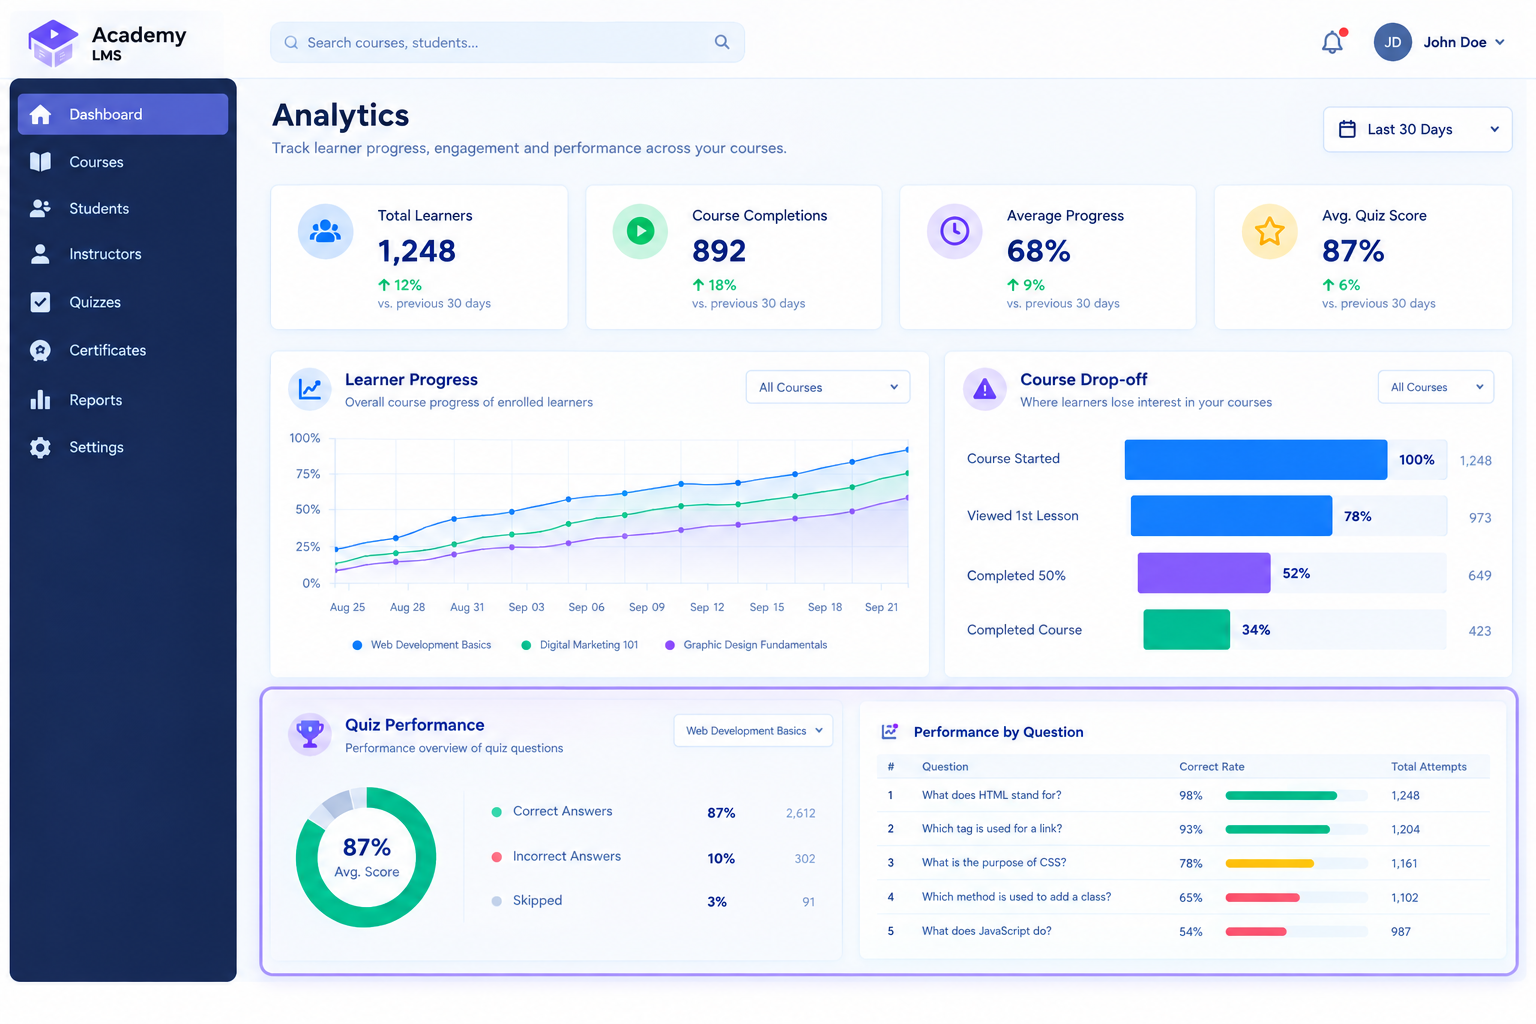
Let’s get practical. Here’s how course creators actually translate analytics data into improved engagement:
Step 1: Identify Drop-Off Points
Pull your lesson-by-lesson completion funnel. Where is the steepest drop? That’s your first intervention point. A drop-off at lesson three in a 15-lesson course often means the ramp from introduction to depth happened too quickly.
Step 2: Analyze Time-on-Content Patterns
If learners are spending significantly longer on one module than others, it may signal complexity rather than depth of interest. Shorter, more focused segments — microlearning — often perform better. Microlearning is now a leading eLearning trend in 2026 precisely because attention and engagement data support it.
Step 3: Use Quiz Data to Redesign Instruction
If 70% of learners miss the same question, the issue isn’t the learner — it’s the lesson that preceded it. Quiz analytics surface these instructional gaps faster than any end-of-course survey ever could.
Step 4: Set Up Automated Re-Engagement Triggers
Modern LMS platforms allow you to automate outreach based on behavioral triggers — a learner who hasn’t logged in for seven days receives a personalized nudge. This approach reduced administrative workload by 40% at the University of New South Wales while significantly increasing participation and assignment submissions.
Step 5: Iterate Based on Cohort Comparisons
Run the same course for two cohorts with one variable changed — pacing, content format, quiz placement. Analytics let you compare outcomes and build toward a version that consistently performs.
Learning Analytics in Action: Real-World Impact
Analytics-driven interventions aren’t theoretical — they’re producing measurable results in real online education environments.
At the University of New South Wales, an analytics system called the Academic Success Monitor analyzed student activity and flagged learners who hadn’t logged in for over a week or missed key assessments. Personalized, automated reminders led to a significant increase in participation and assignment submissions — while cutting administrative workload by 40%.
Online learning increases employee engagement by 18% when implemented effectively in corporate settings . Platforms that combine community-integrated learning with analytics-backed personalization consistently outperform those that treat learners as a uniform group.
The data is clear: course creators who review analytics and iterate keep improving. Those who publish once and hope for the best don’t.
What to Look for in an LMS with Powerful Learning Analytics
Not all LMS platforms are created equal when it comes to analytics. Here’s what separates a useful analytics dashboard from one that just looks good:
| Feature | What to Prioritize |
| Real-time dashboards | See learner activity as it happens, not just end-of-course summaries |
| Learner-level tracking | Individual progress views, not just aggregate data |
| Drop-off and video engagement data | Lesson-level and time-stamp-level insight |
| Quiz analytics by question | Identify specific knowledge gaps |
| Automated triggers | Re-engagement emails, completion reminders |
| Reporting exports | Share data with co-instructors or stakeholders |
| Sales & revenue analytics | Track course performance alongside enrollment data |
Academy LMS: Built for Data-Driven Course Creators
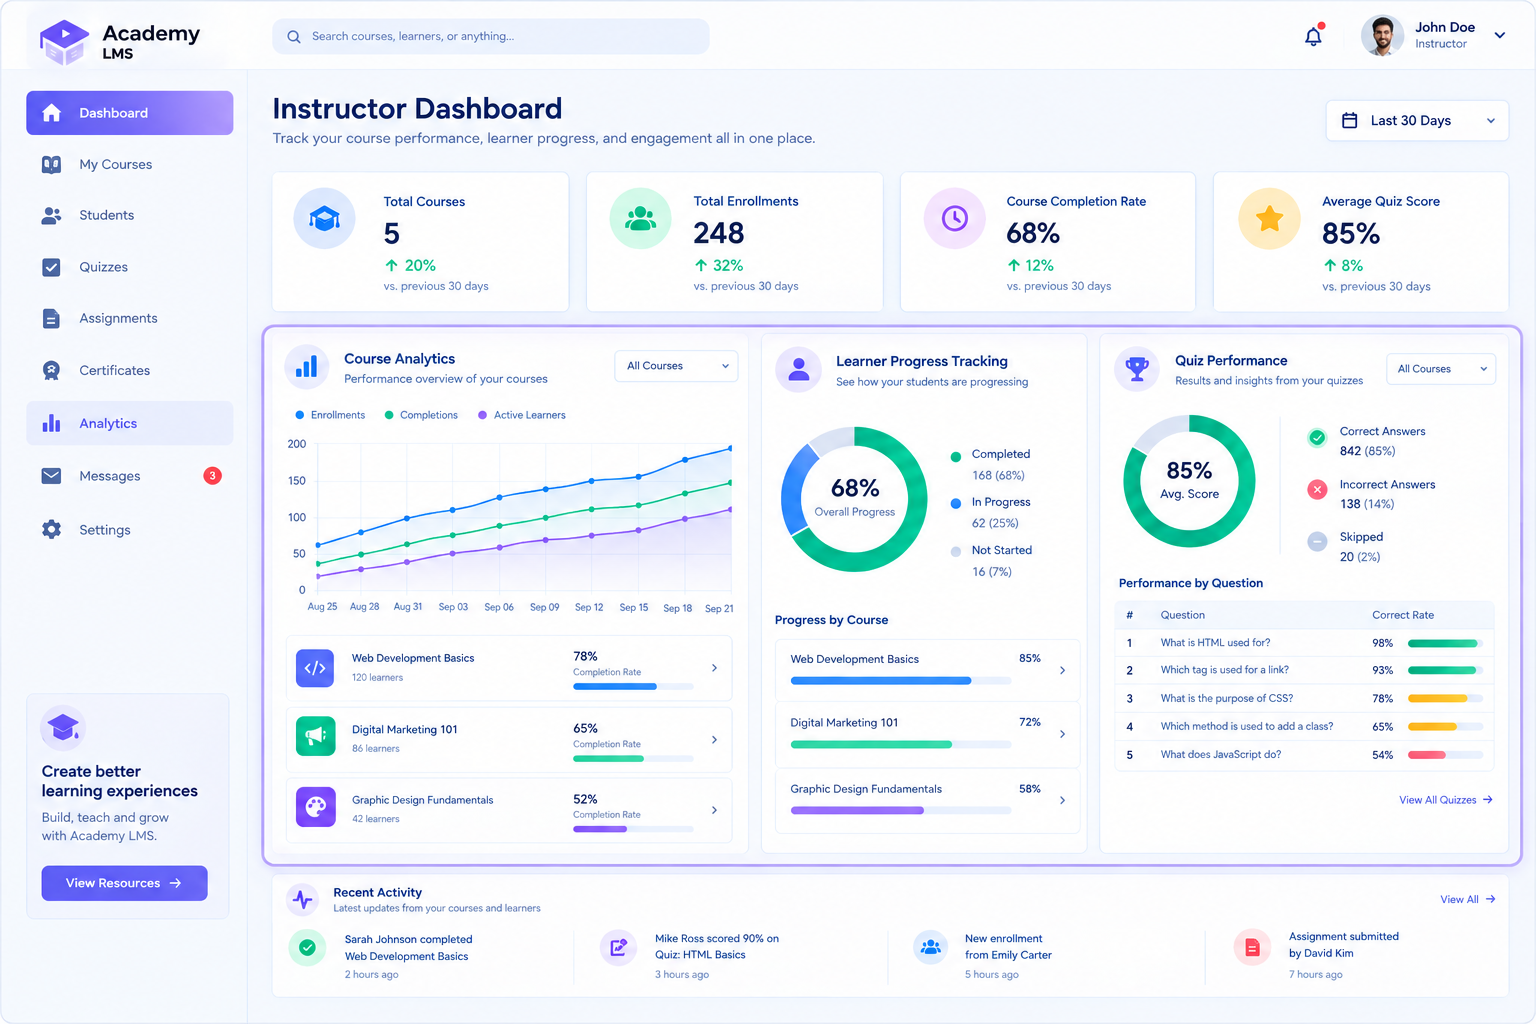
If you’re running your eLearning platform on WordPress, Academy LMS — one of the best wordpress LMS plugins available today — delivers the kind of analytics infrastructure serious course creators need — without the complexity of enterprise tools.
Academy LMS provides detailed analytics to track student progress, course effectiveness, and sales data for improved course planning. Its Course View Analytics feature tracks course views, engagement, and learner activity to provide actionable insights — all from an intuitive instructor dashboard.
Here’s what makes Academy LMS stand out for analytics-focused educators:
- Built-in analytics dashboard for tracking learner progress and course performance.
- Advanced reporting tools offering precise analyses across courses, lessons, quizzes, instructors, and students.
- Attendance tracking with automatic reports and participation records
- Student progress tracking with detailed overviews and individual learner views.
- Quiz and assignment analytics for granular instructional feedback
- WooCommerce integration with sales data reporting for monetized courses
- Automated email triggers including booking notifications and engagement flows
And the Pro version unlocks even more: content drip, subscriptions, SCORM support, live class analytics via Zoom/Google Meet, and full monetization tracking — everything needed to build a scalable, insight-driven eLearning business.
“Academy LMS provides detailed analytics to track student progress, course effectiveness, and sales data for improved course planning.”
For course creators who want to move beyond guesswork and start making data-backed decisions about their content, Academy LMS makes the analytics layer accessible — whether you’re a solo educator or running a multi-instructor platform.
The Future of Learning Analytics: What’s Coming in 2026 and Beyond
Learning analytics is evolving fast. The trends shaping its next phase are worth watching:
AI-powered predictive systems are moving from identifying at-risk learners to automatically generating personalized remediation paths — before a student even realizes they’re struggling. The global AI in education market was valued at USD 8.30 billion in 2025 and is projected to reach USD 32.27 billion by 2030, growing at a CAGR of 31.2%.
Cross-platform data unification is becoming standard — pulling together LMS data, video engagement, email open rates, and community activity into a single learner profile. This gives instructors a fuller picture than any single data source can provide.
Analytics-driven instructional design is replacing intuition-first course development. Creators who start with data questions — “What does my audience struggle with most? Where do similar courses lose learners?” — are building better courses before they record a single lesson.
Frequently Asked Questions About Learning Analytics
What is learning analytics in simple terms? Learning analytics is the practice of collecting and analyzing data about how students interact with a course — what they watch, where they stop, how they score on quizzes — and using that data to improve the learning experience. Think of it as a GPS for your course: it shows where learners are, where they’re heading, and where the road gets rough.
What are the most important learning analytics metrics for course creators? Course completion rate, lesson drop-off rate, time on content, quiz performance by question, and login frequency are the five metrics that give the clearest picture of learner engagement and course health.
How does learning analytics improve student engagement? By identifying where and why learners disengage, analytics enables targeted interventions — redesigned content, automated re-engagement messages, or personalized learning paths — that keep learners moving forward rather than quietly quitting.
What’s the difference between LMS analytics and learning analytics? LMS analytics refers specifically to the data collected within a learning management system. Learning analytics is the broader field of measuring, analyzing, and reporting on all learner data — which can include LMS data alongside video platforms, community tools, and SIS systems.
Can small course creators benefit from learning analytics? Absolutely. Even basic completion rate and drop-off data — available in most modern LMS platforms — gives solo educators the insight they need to improve their courses. You don’t need enterprise infrastructure to make data-driven improvements.
Does Academy LMS offer learning analytics? Yes. Academy LMS offers comprehensive analytics and reporting features to track and evaluate student progress effectively throughout your courses. The Pro version includes an Advanced Analytics dashboard for deeper performance tracking.
Conclusion: Stop Guessing. Start Measuring.
There’s a version of course creation where every update is a coin toss — you change something, hope it helps, and wait to see if completion rates move.
Then there’s the version where you know which lesson loses your learners, which quiz question reveals a gap in your instruction, and which students are three days from quitting — before they actually do.
Learning analytics is what separates those two versions. It turns your course from a static product into a living system you can continuously refine.
The best part? You don’t have to overhaul your entire platform to get started. An LMS like Academy LMS gives you a built-in analytics dashboard, detailed progress tracking, and reporting tools that translate learner behavior into decisions — right within your WordPress site.
Pick one metric. Look at it honestly. Then make one change based on what it tells you.
That’s how data-driven course creators build courses that don’t just sell — they transform.