Data has become a priceless commodity. Businesses, government agencies, and other organizations use data to gauge consumer behavior, predict market trends, process efficiencies, and many more. This is all to acquire a profitable and competitive edge. One of the many business intelligence tools in use today is SAP Crystal Reports.
This platform offers a comprehensive and robust feature set, making it one of the best business intelligence software on the market. However, it is not the only go-to system for professionals. There are many SAP Crystal Reports alternatives out there that rival the platform. In this article, we will be discussing each one of them, paying attention to their strengths and weaknesses so that you can better understand which ones suit your requirements. But first, let’s take a look at what SAP Crystal Reports is and what it can do for your business.
SAP Crystal Reports Overview
SAP Crystal Reports is a business system and top data analysis software that works alongside databases to gather and analyze information and generate actionable insights. The platform helps you create reports from different data sources. Also, you don’t need to create reports from scratch. SAP Crystal Reports has a reports wizard module that guides you every step of the way.
Think of SAP Crystal Reports as a smart spreadsheet application that’s easy to use. It lets you generate reports via sub-reports, cross-tabulation, conditional formatting, and formulas easily. In this way, you can make sense of disparately sourced data and understand hidden relationships. Furthermore, there are geographic maps and graphs to help you convey your data story visually to colleagues or clients.
SAP Crystal Reports integrates well with many business solutions. As such, you can use it to create data visualizations, reports, and dashboards pertinent to different business processes. Lastly, pricing plans start at $495 a month for single users and small businesses.
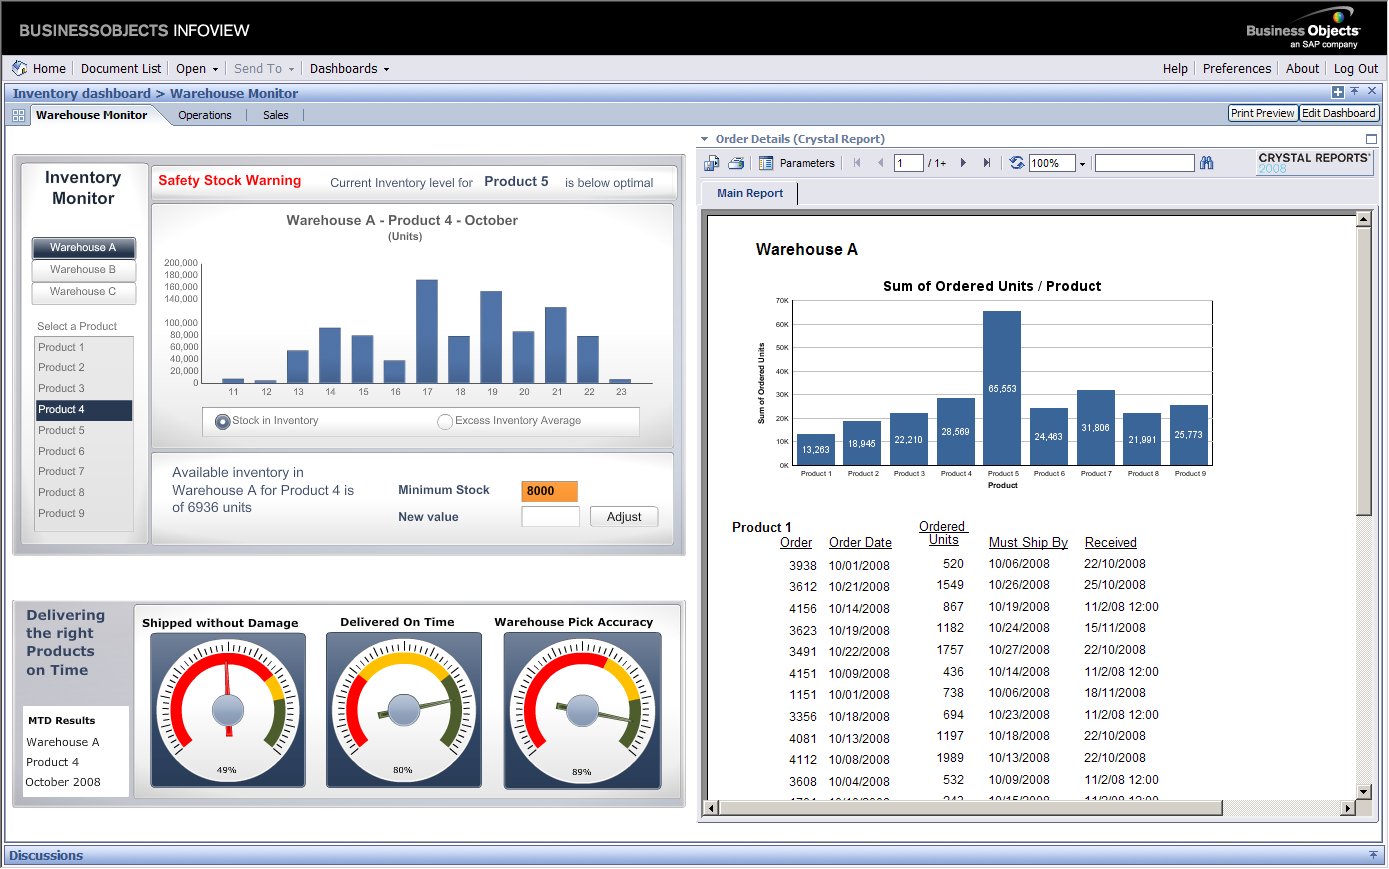
SAP Crystal Reports is a platform that lets you collate, analyze, and visualize all types and sizes of data sets.
Reasons to Look for SAP Crystal Reports Alternatives
SAP Crystal Reports is indeed a robust and comprehensive business intelligence and reporting software. However, there are a few issues that many of its users encounter. Hence, they look for SAP Crystal Reports alternatives. For starters, small business users find it a bit pricey at $495 for a single user. Many individuals and small businesses simply can’t afford it.
Secondly, many feel that the learning curve is quite steep as well, making it a bit inaccessible to tech-averse users. This makes it difficult for them to get acquainted with the functionalities of the platform, much less how to make the most of it.
Thirdly, and in connection to the second, it is quite advanced. There are many features that casual users don’t know how to leverage. Fourth, many feel that there are other tools for one-off reporting that are better than SAP Crystal Reports available on the web. Thus, there is no use for learning the ins and outs of complex software just to get a job done easier using other platforms.
However, if you are a data-driven company that requires comprehensive business intelligence reporting tools, then SAP Crystal Reports is a great choice. But it is not the only option. Below, we’ll give you the cream of the crop of business intelligence reporting tools on the market that rival SAP Crystal Reports.
Top SAP Crystal Reports Alternatives
1. GridGain In-Memory Data Fabric
GridGain In-Memory Data Fabric version 7.5 is the most advanced business intelligence reporting product from popular service providers. The platform offers users the ability to compute, cache, and distribute data in memory. Its key features include in-memory data grid, compute grid, real-time streaming, ANSI 99 in-memory SQL, and in-memory file system, among many others.
Other capabilities that round out its comprehensive feature list include machine and deep learning, memory-centric computing, distributed key-value store, and co-located processing. In this way, you won’t have to worry about computation speed and power. Also, its Enterprise edition also includes a centralized backup and recovery management feature.
All of these provide users with ways to handle and process data in terms of gathering, analyzing, and generating actionable insights. Lastly, the platform is available via personalized quotes.
2. i-net Clear Reports
i-net Clear Reports is a tool designed to help analytic departments, department managers, and even C-suite executives make use and make sense of data. What’s more, i-net Clear Reports is an easy-to-use visual report designer that is available for free.
With this at your disposal, you can run reports on any platform. Furthermore, you can use various layout objects to create stories and visualizations. Plus, you can create them using information from any JDBC data source. The platform is also fast and powerful and can be very intuitive for first-time users who have a background in business intelligence.
Furthermore, this tool can help you create customized reports and access them from all types of devices. Report modules provide users a chance to simplify complex data into easily-communicated reports. In addition, users can make use of private databases or provide access to external program servers for data harvest. It can also easily integrate with virtually all business systems. For pricing, plans start at $2,580 for one CPU.
3. Windward AutoTag
Windward AutoTag is a reports creation and design platform used by individuals and businesses. Also known as AutoTag Report Builder, this tool is easy to use for report writing and document creation. Also, it allows developers and programmers to create and edit all types of reports, including those for MS Office.
Thanks to its AutoTag for MS Word and Excel, you can link documents and spreadsheets to any data source. Also, many enterprise-grade organizations use the platform as well. This is especially true when they need data from different sources.
Moreover, Windward AutoTag allows you to create professional-looking, easy-to-understand reports that are consistent with their brands. It is not just easy-to-use; it is also full of functionality. While it is less advanced than SAP Crystal Reports, it is a true contender if you want simpler things done for less investment. If you’re interested, pricing is done via personalized quotes.
4. Aspose.Total for Reporting Services
Aspose.Tool for Reporting Services is a suite of rendering extensions for Microsoft SQL Server Reporting Services. Thus, it allows developers to export RDL reports easily to either Word, PDF, PowerPoint, and Excel. Plus, you can even add barcodes to enhance the workflow of your exported documents.
What’s great about the tool is that it automatically adds new rendering extensions or new versions of rendering extensions for free. As such, you can be more productive and deliver solutions that are of high quality to your clients easily.
Other features include high-fidelity rendering and printing, Excel dashboard creation, RDL report to PDF rendering, and RDL reports creation. For pricing, packages start at $2,999 for small businesses.
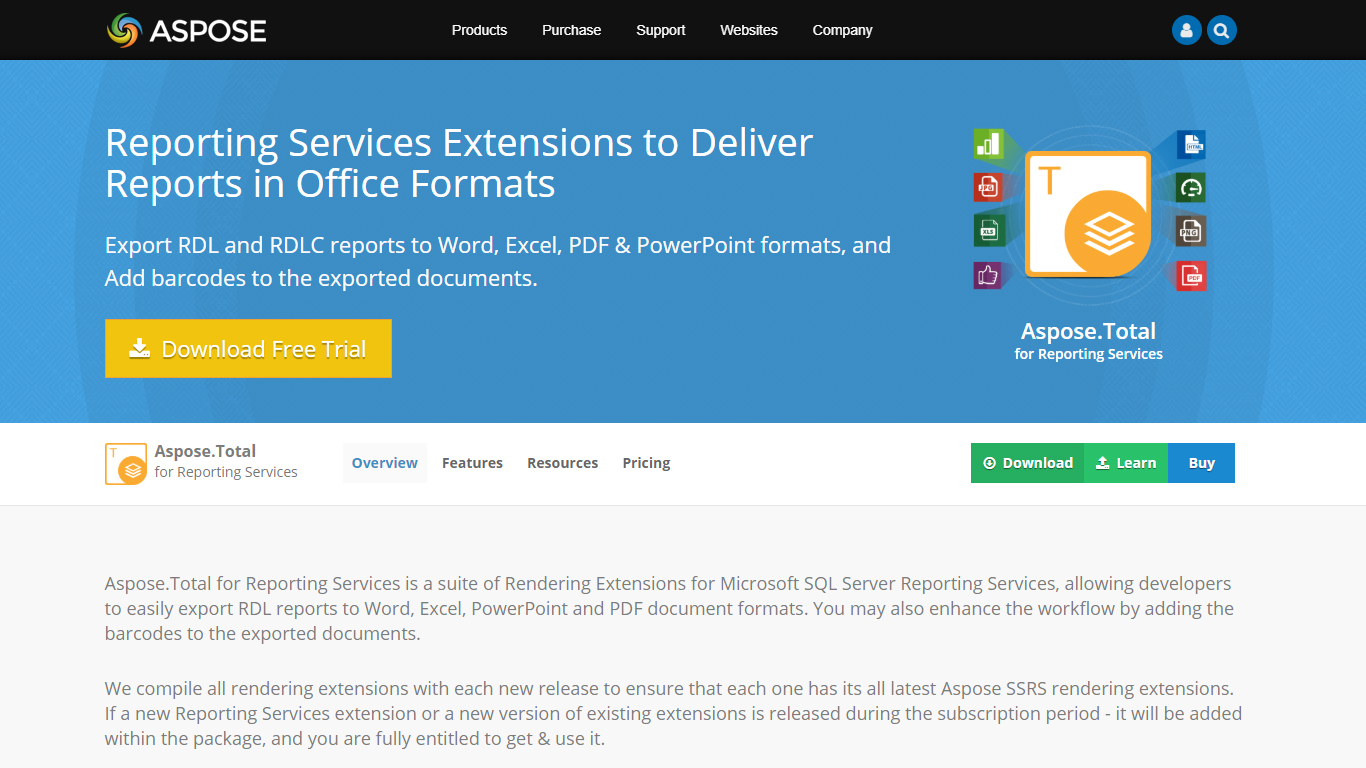
Aspose.Tool for Reporting Services that simplifies the rendering of dashboards and various reports.
5. SharpDevelop Reports
SharpDevelop Reports is a cross-platform.NET reporting software solution for web-based applications and Windows. It provides its own servers and databases to help you generate fast reports. Moreover, it offers a document management module that is easy to use. Plus, SharpDevelop Reports includes support for many native databases too.
Reports from the platform are easily shareable. You can opt to print them or distribute them via PDF. Also, it uses the Push Data Model so you can create reports from .xsd files. Alternatively, it lets you use the Pull Data Model to support the use of Stored Procedures. As such, you can be sure that SharpDevelop Reports can help you with your various reporting needs.
With these, you can quickly generate insights from past reports as well as weave data stories to create better, shareable, and more understandable pictures of your data. Lastly, at the time of writing, this is still an open-source platform.
6. Pentaho Community Edition
Pentaho Community Edition is a solution designed for small to large enterprises that need basic reporting solutions to keep up with the rising data-driven culture of today. It includes features for data analysis, representation, reporting, and other business intelligence tools that can help increase business efficiency.
What’s great about Pentaho Community Edition is that users can also access the PDI marketplace and BA server as well. With this, they can get in touch with other users and communities using the platform. Moreover, they can take a look at apps that can help them increase the platform’s effectiveness.
This is a comprehensive platform for business intelligence, analytics, and reporting. Thus, you can avail of it via a quote-based personalized plan that fits your exact needs.
7. Telerik Reporting
Telerik Reporting provides users with a reporting engine for ASP, .NET, HTML5, Mobile, Ajax, and Touch platforms, among many. The solution offers report viewers for all these platforms. Plus, it lets you create interactive one-time or ad-hoc reports for web, desktop, and mobile applications.
Among its key functionalities are report delivery, data binding, multiple reports types, OLAP data engine and data binding, and easy ad-hoc report creation. Plus, you can gather and analyze data from different sources as well. All these features allow you to create easy-to-understand reports for commercial and even individual scales.
The platform also includes a visual studio report designer. Also, there are features, including maps, charts, barcodes, mail merge, and interactive reports. Moreover, you can export all of these to popular file types, such as Word, PowerPoint, and Excel, among others. For pricing, you can get this product for as low as $599.
8. Simple Reports
Simple Reports is a simple generator tool designed to create different professional-looking reports. It provides report designers and easy-to-use dashboards for better analysis. Plus, this solution can handle varied data sources at once, just like a proper reporting platform.
Moreover, this is best for creating ad-hoc reports. As its name suggests, report creation is very simple with this platform. What’s more, simple does not mean bland non-substantial reports. It just means a simple professional report creation.
This includes straightforward embedding of data into reports as well. Plus, via HTML, you can preview and print your reports to make them more attractive and easily shareable. The solution helps you create warehouse inventory records, market trends, consumer behavior trends, and sales statistics, among many others. Now, with Simple Reports, you can truly make complex data simple.
9. Ubiq
Ubiq is an application for reporting and analytics for PostgreSQL and MySQL. With Ubiq, like any other app in this compilation, you can easily create dashboards and reports. It is also very easy to use. This is thanks to its drag-and-drop interface.
Ubiq allows you to apply powerful functions and filters. Also, it provides you with the opportunity to share your professional-looking reports with your team. Moreover, Ubiq supports data from on-premise types and those on the cloud.
Furthermore, Ubiq is so easy to use that you can quickly build interactive dashboards without knowing how to code. It also works seamlessly with applications from Oracle, Amazon, and Google, to name a few. Lastly, pricing plans start at $29 per month for one user, which includes three dashboards.
10. JasperReports
Last but not least is JasperReports, is one of the popular open-source SAP Crystal Reports alternatives. This tool is based on Java, but it can be used for a wide variety of targets, such as HTML, Microsoft Excel, XML, CSV, and PDF, among others.
Furthermore, the JasperReports Library is a very popular open resource for reporting engines. As mentioned, it is entirely written in Java. Also, it can handle different types of data coming from various sources. Moreover, it produces pixel-perfect documents that you can view, print, and export.
However, this program is not for casual users. It is just like many of these open-source tools here. They are easy to use for professionals but a little too complicated for non-tech-savvy users who have no experience with business intelligence.
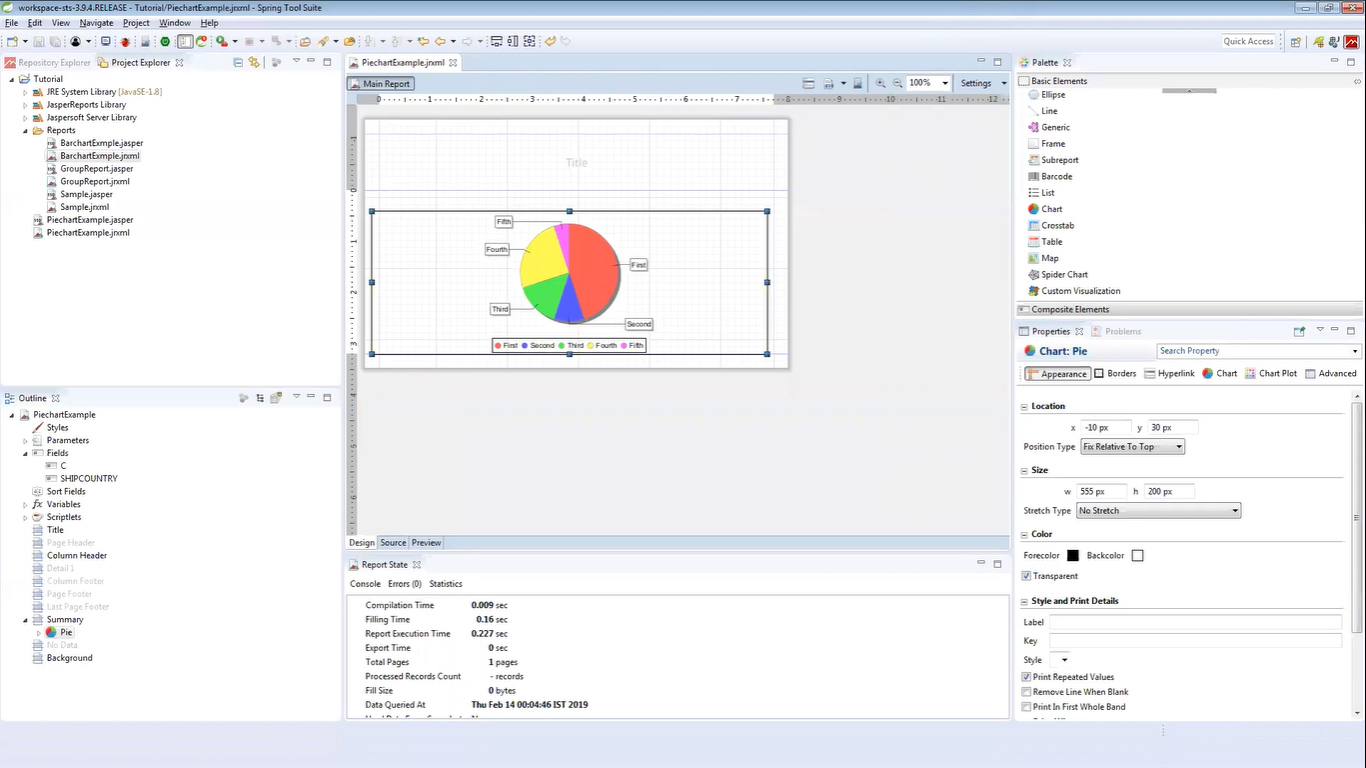
JasperReports is an open-source platform built for BI professionals who want flexibility in creating reports and dashboards.
What is the Best Alternative to SAP Crystal Reports?
This question does not have a straightforward answer. However, there are cases where SAP Crystal Reports can be your best choice. For instance, it’s great if you don’t have coding skills but have knowledge about statistical tools in business intelligence.
However, if you have technical skills, you can choose from open-source options like JasperReports and Simple Reports. These are not the most user-friendly applications, but they can rival the best SAP Crystal Reports alternatives out there in terms of flexibility.
That said, there is no way of knowing which one is best for you. All you can do is test each product and see whether it fits your needs and your preferences. So, we hope that we have given you enough choices in this article.