Kibana Review
- What is Kibana
- Product Quality Score
- Main Features
- List of Benefits
- Technical Specifications
- Available Integrations
- Customer Support
- Pricing Plans
- Other Popular Software Reviews
What is Kibana ?
Kibana is a data discovery, visualization, and navigation solution combined in one platform that allows users to track and manage their ElasticStacks. This way, they are constantly aware of the status of their business operations. The system also allows users to build data images such as graphs for visualizing business information. And for creating more engaging presentations, users can integrate the system with Vega Grammar that allows for a more dynamic data image design. It can also explore relationships between Elasticsearch data, which results in a better grasp of how factors affect each other and determine the current overall health of the business.Product Quality Score
Kibana features
Main features of Kibana are:
- Advanced Time Series Analysis
- Dashboard Sharing
- Grok Debugger
- Graph Exploration
- Data Addition
- Geospatial Data
- Developer Console
- Visualization & Dashboard Exporting
- Search Profiler
- Data Visualization
- Pipeline Management
- Anomalies Exploration
- Users & Roles Control
- Vega Grammar
Kibana Benefits
The main benefits of Kibana are its open source nature, the customization of visualizations, graph exploration tools, anomaly detection capability, and secure data sharing. Here are more details:
Open source
Kibana is an open source platform, which means it is free to utilize and users are allowed to explore its source code on GitHub. Because of that, users who have enough know-how will have enough information to determine how the system functions. It is also a budget-friendly application since it is distributed with its own Node.js web server. As such, there will be no need to add more codes or infrastructure.
Customized visualizations
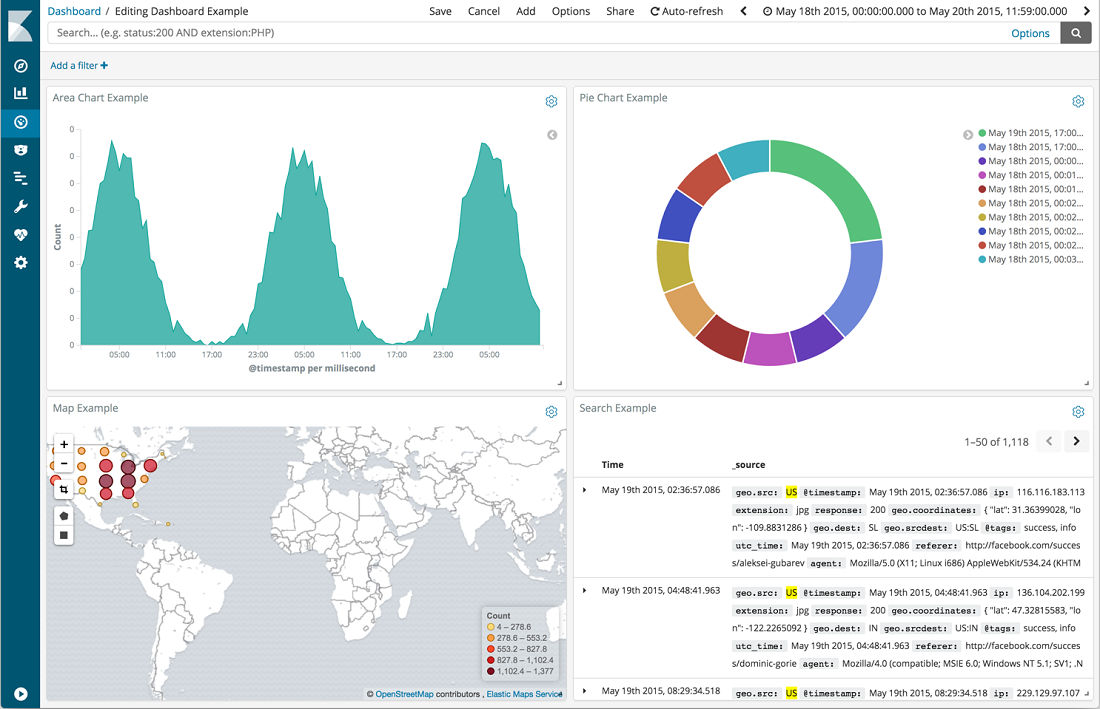
Kibana provides users with basic visualization tools, such as line graphs, histograms, and pie charts, together with the option of letting them design their own data images. Because of this, the graphical presentation of data is optimally in tune with the users’ needs and preferences. This is accomplished through Vega Grammar, which is a visualization language that Kibana can fully integrate with.
Graph exploration tools
The system, via graph exploration feature, allows both the plotting of data points and exploration of relationships between them. It acts as a search engine with the capability to determine the relevance of data points with one another. Through this, a better understanding of how each factor affects another is gained.
Issue detection
The system can detect certain issues, particularly anomalies hidden in the data, which is helpful in pinpointing the root cause of problems and finding solutions for them.
Secure data sharing
Kibana visualizations and dashboards can be easily shared with colleagues or other people by simply embedding them into web pages or sending the link to intended recipients. Users can also show their dashboard to more people while retaining full control over what information can be viewed by them, hence securing sensitive information against leakage. Data can also be exported in PDF or CSV format files.
Technical Specifications
Devices Supported
- Web-based
- iOS
- Android
- Desktop
Customer types
- Small business
- Medium business
- Enterprise
Support Types
- Phone
- Online
Kibana Integrations
The following Kibana integrations are currently offered by the vendor:
- Elasticsearch
Video
Customer Support
Pricing Plans
Kibana pricing is available in the following plans: