In the last decade, data-driven decisions have become synonymous with success. Many businesses attribute their success to the instrumental role of analytics software. A focus on “big data” and harnessing high volume datasets has elevated the discourse on analytics software and its capabilities.
Analytics software goes beyond mere data collection. It empowers businesses to understand the intricacies of customer behavior, anticipate their needs, and dynamically adapt to evolving market demands. According to Deloitte’s recent Analytics Advantage Survey, a notable 49% of respondents attributed better decision-making in their enterprises to the strategic utilization of data, which is often facilitated by sophisticated software.
But how can and should data really drive our decisions? What can data know about our businesses and customers that we don’t, and how can we access that knowledge? In this article, we explore these questions and others, investigating the many applications of analytics software in shaping the trajectory of business growth.
Why Data, and Why Analytics Software?
Data has many uses for the business owner or analyst.
Data helps businesses:
- Identify patterns and trends.
- Interpret past outcomes.
- Find new customers.
- Understand their company’s strengths and weaknesses.
- Inform decision-making.
- Improve marketing targets and approaches.
- Explain and track long-term changes.
- Project data into the future if certain variables change and others stay constant.
- Identify future problems.
- Predict future user engagement and revenue.
- Provide stakeholders with evidence of the impact of their investments.
What kind of data will you need for each of these purposes? It depends on the nature of your business. For instance, you might collect site traffic and page duration data to measure the effectiveness of your marketing approach, keywords and backlinks if you write SEO content, or customer retention data to measure how satisfied customers are with your product over time.
Analytics software makes collecting and tracking these data points systematic—and often, automatic. Software allows you to define the type of data you want to see every month and generate automatically updated visualizations of it. You won’t have to pour over Excel just to update your metrics and display them in a meaningful way.
Types of Analytics Software
There are several types of analytics software. Analytics are sometimes incorporated with general business management software, but they can also be included in industry-specific software as a feature. For instance, let’s say you are starting a rental business. After you’ve acquired properties and filled your units with tenants, you can make an account on a property management software platform that will automatically generate and track key metrics like occupancy rates, tenant retention, and rental revenue.
Some software platforms are further classified as business intelligence programs. Business intelligence software is software that collects and curates data to generate both actionable insights and accessible visual representations. Business intelligence is built on analytics and directly drives decisions that lead to future business growth and development.
What Kind of Analytics Can Software Provide?
Analytics software is not only about speed and automation. The processing power of software allows business owners to garner big-picture perspectives and visualize data that would otherwise be inaccessible. It can help you look at data in a new way, including ways you might not have considered useful. The same set of data can reveal vastly different types of insights depending on which type of analysis is performed.
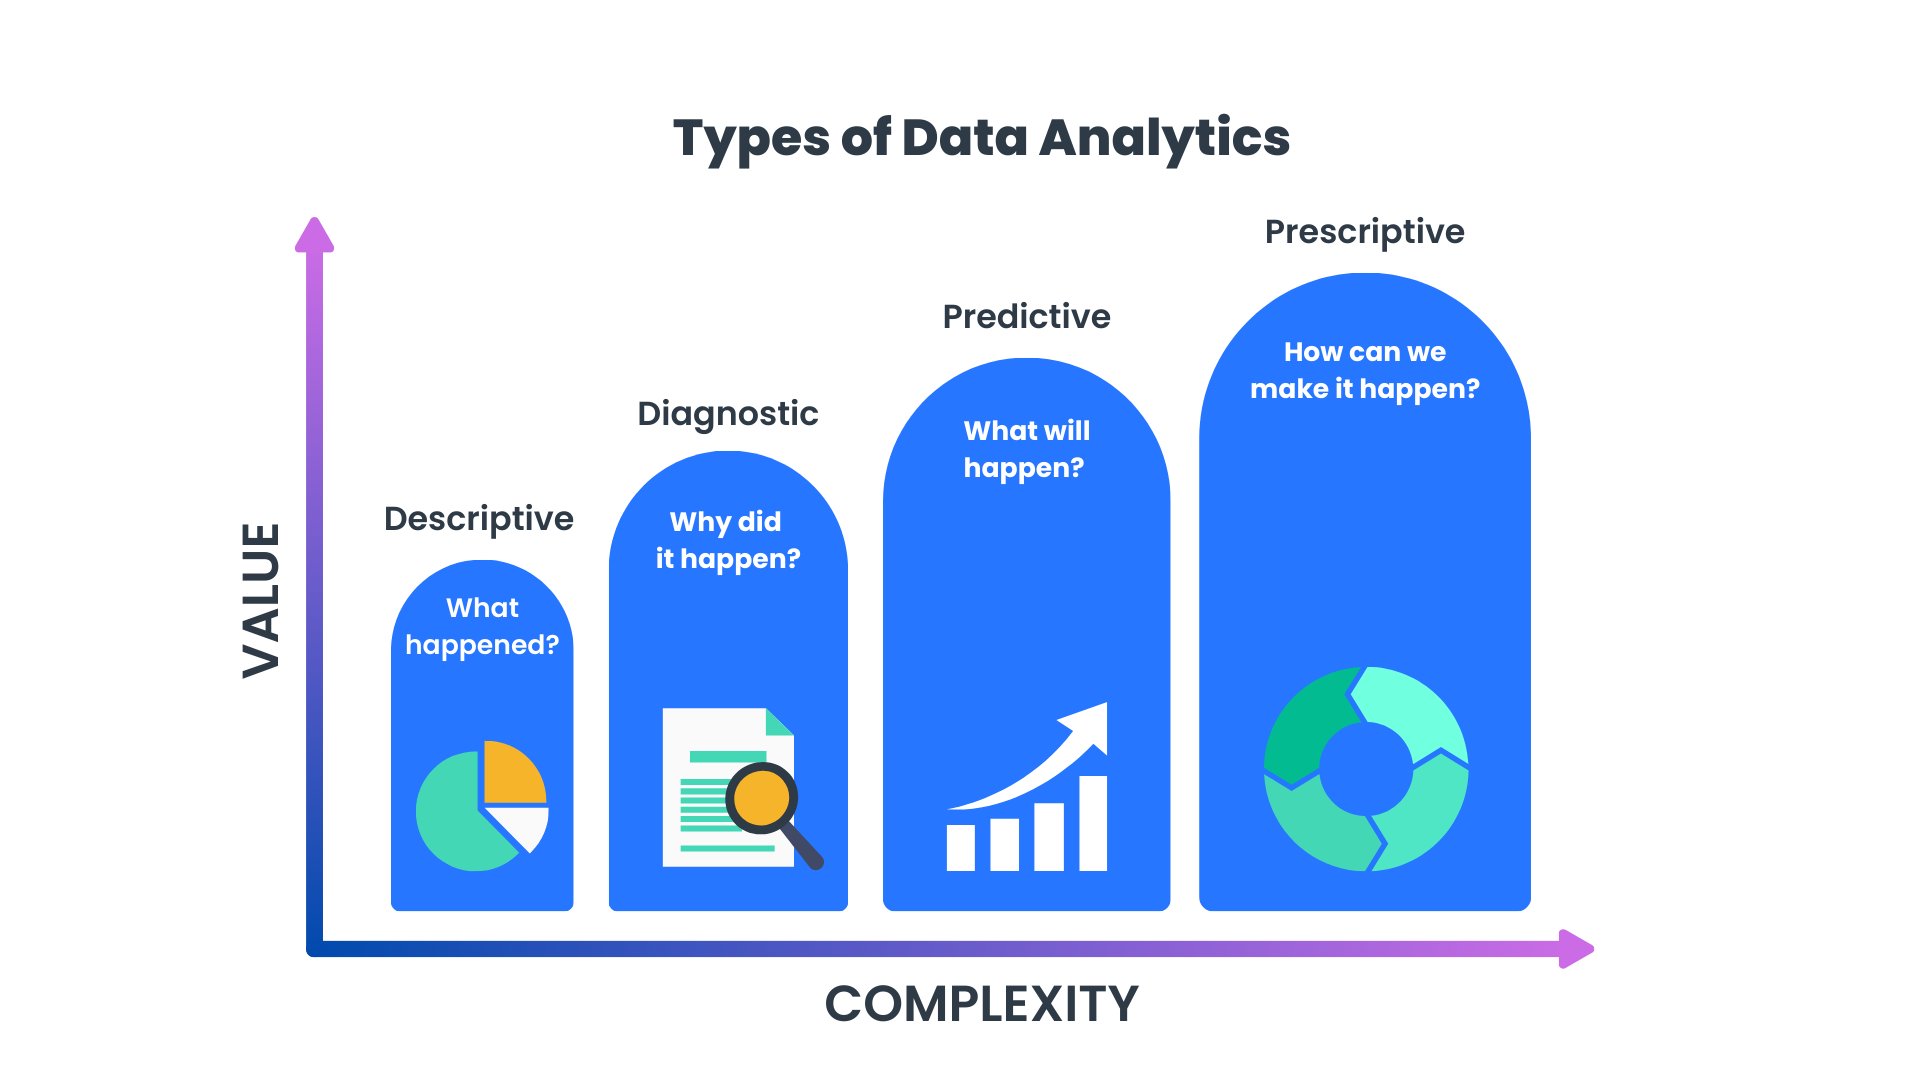
Microsoft divides analytics into four different types, each with a different business objective:
- Descriptive analytics
- Diagnostic analytics
- Predictive analytics
- Prescriptive analytics
Descriptive analytics interpret past data that has already been collected to identify trends. Descriptive analytics describe the data you’ve collected and help you understand the current state of progress toward your goals.
Diagnostic analytics takes the descriptive data you’ve collected and analyzes the probable causes to explain that data. The idea is to narrow down which variables most influence outcomes (often using techniques like data mining). This type of analysis is useful when you want to find out whether a recent change you’ve made had the impact you were looking for, or which variable is most likely to be the cause of a period of regression.
Predictive analytics use data measured over time to forecast future data, using statistical modeling and machine learning. Predictive analyses project the trends identified in descriptive and diagnostic analyses into future months or years. It’s the data analyst’s job to use this data to decide the next course of action.
Finally, prescriptive analytics use both the descriptive and prescriptive approaches to recommend specific actions for the company. Prescriptive analytics are the most complex type of analytics. They are like predictive analytics in that they concern the future; however prescriptive analytics advises specific steps to produce a desired outcome rather than simply projecting what the outcome will be given certain variables.
Predictive and prescriptive analytics are more complex, but they also provide the most value for your business. Analytics software can provide access to all four of these types of data analysis.
Functions and Features of Analytics Software
Analytics software platforms have a variety of built-in features and functions. Here are a few of the most common:
- Data aggregation
- Data mining
- Content gap analysis
- Forecasting
- Visualization
For instance, let’s say support calls are taking four minutes longer than average in January. Your customer support software could help you use data mining to narrow down the problem, supplying you with vital insights about the length of calls and satisfaction rates.
Likewise, imagine that you’re building a brand online for your new product but don’t understand why your competitors are generating so much more traffic than you. Analytics from your content management system software might show you keywords you aren’t targeting or blog article ideas you hadn’t considered yet.
Best Analytics and Business Intelligence Software of 2023
Here are just a few of the top-ranked data analytics software platforms in 2023:
- Microsoft Power BI – A data analytics platform that helps business owners create dynamic visualizations of their data to garner critical insights.
- Google Analytics – A real-time reporting and consumer data analytics tool that generates reports, captures dynamic customer stories, and models future possibilities for user engagement and behavior with its predictive capabilities.
- Tableau— Data analytics software used in business intelligence to visualize and understand data. You can host it on your own server or host with Tableau Online.
- Domo –A business intelligence and analytics platform with reporting and AI-generated insights.
- Looker – A data analytics software company and business intelligence platform acquired by Google and now part of the Google Cloud Platform.
- Qlik Sense—A data analytics solution fully customizable with open APIs.
Driving Business Decision-Making with Data
Modern businesses are under an extraordinary amount of pressure to understand and use the vast data resources available to them—or else run the risk of being surpassed by competition. Using software eases that pressure, making big data more manageable and key insights more discernable.
Critically, analytics software makes data more accessible. Before software, large amounts of data were only legible by the trained analyst or data engineer. But while the expertise of a professional analyst is still valuable and often necessary, the data itself is now vastly more comprehensible. It’s easy to see vital insights right on your dashboard. And that makes decision-making based on those insights faster, more streamlined, and more efficient.
Conclusion
In the dynamic landscape of modern technology, the role of data in directing decision-making has become paramount. The ability of analytics software to transform raw data into actionable insights cannot be understated. With its help, your business has the power to extract meaningful information from a seemingly vast and inscrutable collection of numbers.