Google Chart Tools Review
- What is Google Chart Tools
- Product Quality Score
- Main Features
- List of Benefits
- Technical Specifications
- Available Integrations
- Customer Support
- Pricing Plans
- Other Popular Software Reviews
What is Google Chart Tools?
Google Charts Tools allows you to showcase data on your website using some simple but attractive visualizations. With a simple embedding of JavaScript, users can create a wide variety of charts for their website. Whether it’s just some simple line chart or a complex hierarchical map, you can present data in a digestible way with Google Charts Tools. The software is also completely free and you can either utilize the default theme or choose from an extensive list of customization options to create a chart. It is also easy to use and is backed by a robust active community. Other key features include timelines, word trees, development tools and animation.Product Quality Score
Google Chart Tools features
Main features of Google Chart Tools are:
- Overlays
- Word Trees
- Development Tools
- Timelines
- Trendlines
- Animation
- Chart Editor
- Controls and Dashboards
- Crosshairs
- Data Tables
- Data Views
- Formatters
- Lines
- Cross-browser compatibility
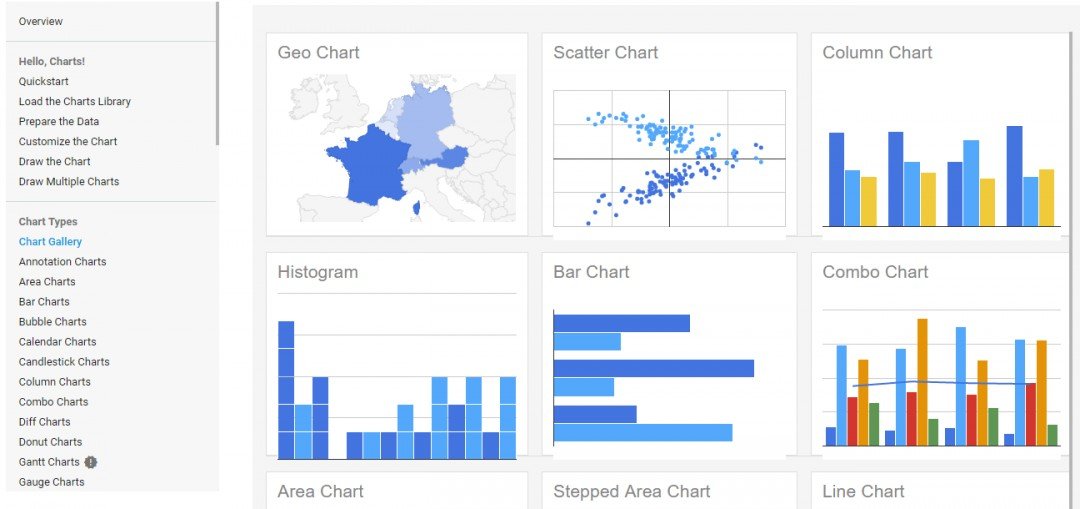
- Chart Gallery
- Events
Google Chart Tools Benefits
The main benefits of Google Chart Tools are, it is free, intuitive and highly configurable. Here are more details:
Free
Even with its powerful capabilities for building online visual charts, Google Chart Tools won’t charge you a dime: it is free. This tool can be utilized by anyone, be it government agencies, freelancers, large enterprises, professionals or even casual users looking for a cost-efficient tool.
Easy to use
Google Chart Tools is a user-friendly, which only requires a small bit of JavaScript knowledge to be utilized to its fullest. It allows the creation of even the most complex graphs and charts. Users will also find the tool easy to integrate into their website. They only need to embed the app, upload the libraries and then they can proceed to enter the data that they need to display the chart.
Customizable
Most users are satisfied with using the default Google theme for their charts because of how presentable it looks and it’s also the easiest one to use. However, users are always welcome to tweak the software using its customization options. The feature allows you to blend the charts with your website’s feel, aesthetics and branding. The charts can be customized with different colors, overlays, lines and points, among others.
Interactive
Animations, events and other interactive elements can be integrated into the chart for better user experience. Users can utilize the tool’s dashboard which gives them complete control over how their data are being displayed. It also lets them tweak the data based on the times, dates and roles.
Link data
Google Chart Tools allows the data to be sourced from various locations such as Fusion tables and Google Sheets. Users can also utilize several data connection protocols and tools to empower them with real-time data linking.
Technical Specifications
Devices Supported
- Web-based
- iOS
- Android
- Desktop
Customer types
- Small business
- Medium business
- Enterprise
Support Types
- Phone
- Online
Google Chart Tools Integrations
The following Google Chart Tools integrations are currently offered by the vendor:
The vendor didn’t provide any details on integration.
Customer Support
Pricing Plans
Google Chart Tools pricing is available in the following plans: